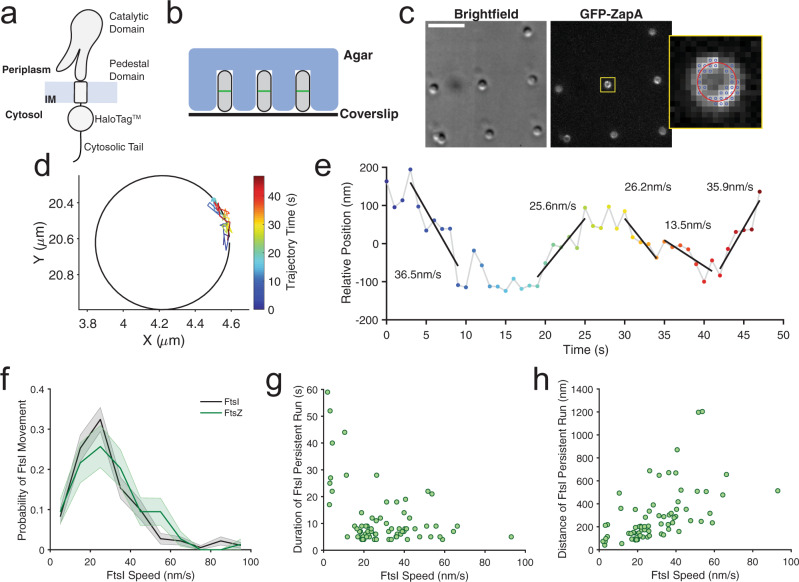
Fig. 4. Experimental characterization of FtsI directional motion.
a Schematic of the functional sandwich fusion of FtsI. The Halo tag is inserted between residues 18 and 19 of FtsI, immediately before the first residue of the transmembrane (TM) domain. b Diagram of individual E. coli cells loaded in microholes made by nanopillars. c Brightfield and fluorescence images of microholes loaded with E. coli cells labeled with GFP-ZapA and Halo-FtsISW fusion proteins. Inset shows the zoomed image of one cell in the yellow box. Blue circles indicated the pixels used for the fit of ZapA-GFP circle. Scale bar is 5 µm. Experiment repeated 18 times with similar results. d Circle-fitting of GFP-ZapA image super-imposed with the trajectory of a single FtsI molecule, colored in time. e the unwrapped trajectory from D with fitted lines at each segment to extract directional speeds, persistent run duration and distance. f Distributions of FtsI’s directional movement speeds (n = 77 trajectories, 74 directional events) and FtsZ’s treadmilling speed (from Yang et al.13). For the purpose of this study, we only plotted the fast-moving population of FtsI that follows FtsZ’s treadmilling and leave out the slow-moving population of FtsI that we show to be independent of FtsZ’s treadmilling13. Both FtsI’s and FtsZ’s histograms were bootstrapped 100 times to provide the shaded standard error bars (mean ± S.E.M.). A two-sample Kolmogrov–Smirnov test comparing the two datasets showed no difference in their distributions (p = 0.1852). g Dependence of the duration of FtsI’s persistent run on its speed. h Dependence of the distance of FtsI’s persistent run on its speed.

