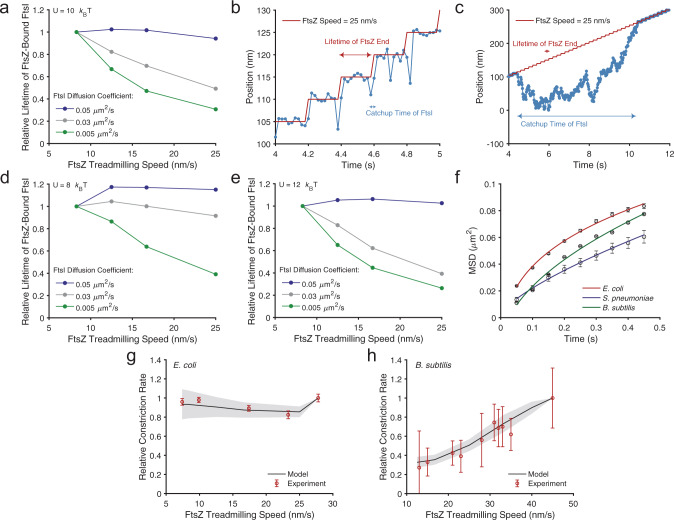
Fig. 5. Diffusion and binding potential modulate sPG synthase’s processivity on FtsZ’s treadmilling speed.
a Predicted dependence of FtsZ-bound FtsI lifetime on FtsZ treadmilling speed with a binding potential of 10 kBT at different FtsI diffusion coefficients. b A representative trajectory of persistent end-tracking when FtsI diffusion is fast (0.05 μm2/s). c A representative trajectory of persistent end-tracking when FtsI diffusion is slow (0.005 μm2/s). d Similar to a, but with a weaker binding potential (8 kBT) at different FtsI diffusion coefficients. e Similar to a, but with a stronger binding potential (12 kBT) at different FtsI diffusion coefficients. For a, d, and e, FtsI is initially randomly positioned along an FtsZ filament. The lifetime of FtsZ-bound FtsI was defined as the first time that FtsI escapes from either end of the FtsZ filament for greater than 100 nm. For b and c, the model results are plotted every 2 × 10⁻² s with a simulation time step of 10−5 s. f Mean-squared displacement (MSD) of FtsI, PBP2b and FtsW outside the septum in wildtype E. coli, B. subtilis, and S. pneumoniae. The fitted diffusion constants of FtsI, PBP2b, and FtsW were 0.041, 0.038, and 0.028 µm2/s, with α = 0.29, 0.51, and 0.71, respectively. Error bars represent standard error of the mean. g Model fitting of the dependence of sPG synthesis activity on FtsZ treadmilling speed in E. coli. The relative experimental data of sPG synthesis activity was taken from previous constriction rate measurements in Coltharp et al.42 and Yang et al.13 (mean ± S.E.M., each paper reported at least n > 30 cells). h Model fitting of the dependence of sPG synthesis activity on FtsZ treadmilling speed in B. subtilis. The relative experimental data of sPG synthesis activity was taken from previous cell division time measurements in Bisson-Filho et al.12 (mean ± standard deviation. n = 100 cells for cell constriction measurements, n > 50 cells for treadmilling measurements). For g and h, the model fitting used the measured diffusion constants from f, with varying binding potentials determined by lower and upper limits (E. coli: 8 and 9 kBT; B. subtilis: 10 and 12 kBT), marking the boundaries of the shaded regions.

