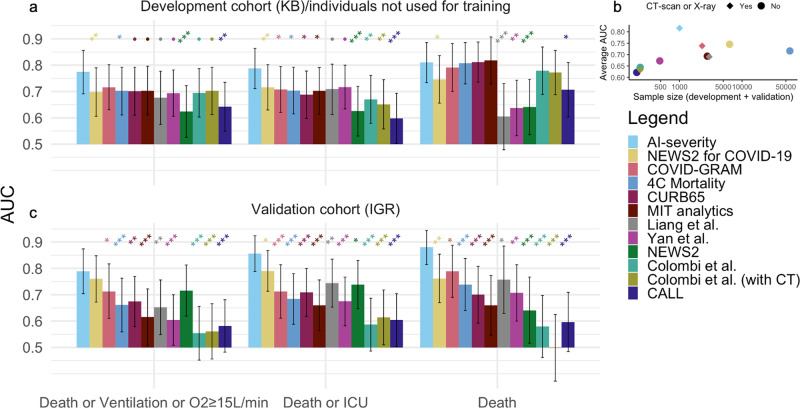
Fig. 2. AUC values when comparing AI-severity to other prognostic scores for COVID-19 severity/mortality.
The AI-severity model was trained using the severity outcome defined as an oxygen flow rate of 15 L/min or higher, the need for mechanical ventilation, or death. When evaluating AI-severity on the alternative outcomes, the model was not trained again. a AUC results are reported on the leftover KB patients from the development cohort (150 patients). b The mean AUC (averaged over outcomes and over hospitals) as a function of the sample size (sum of sample sizes for the development and validation cohorts) used to construct the score. c AUC results are reported on the external validation set from IGR (135 patients). Models are sorted from left to right (and from top to bottom in the legend) by decreasing order of AUC values (averaged over outcomes and over hospitals). Error bars represent the 95% confidence intervals obtained with the DeLong procedure. Stars indicate the order of magnitude of p-values for the DeLong one-sided test in which we test if AUCAI-severity > AUCother score, • 0.05 < p ≤ 0.10, *0.01 < p ≤ 0.05, **0.001 < p ≤ 0.01, ***p ≤ 0.001. KB Kremlin-Bicêtre hospital, IGR Institut Gustave Roussy hospital, ICU intensive care unit, NEWS2 National Early Warning Score 2, AUC area under the curve.

