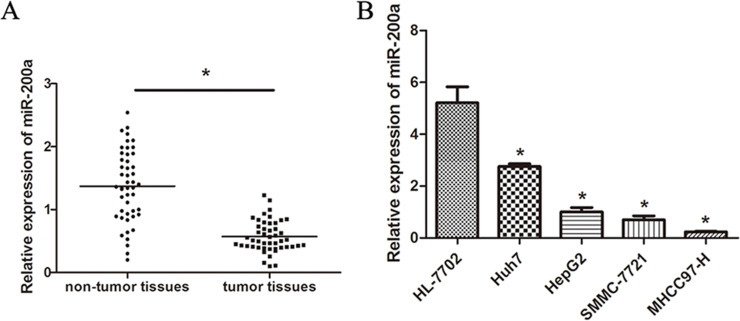
Figure 1.
Expression of miR-200a in HCC tissues and cell lines. (A) Expression of miR-200a in HCC tissue and corresponding adjacent noncancerous tissues. (B) Relative expression of miR-200a in four HCC cell lines (Huh7, HepG2, SMMC-7721, and MHCC97-H) and a human normal liver cell line (HL-7702) as analyzed by RT-PCR. The data represent the mean ± SD. *p < 0.05.

