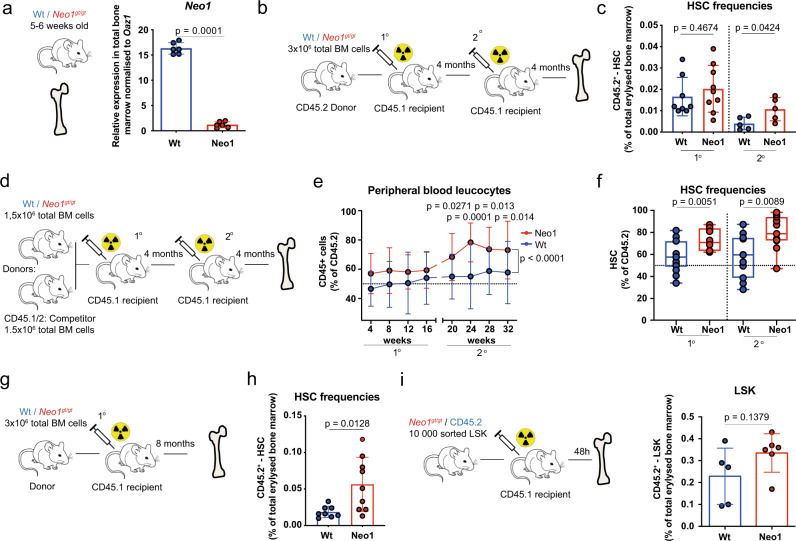
Fig. 2. Mutant Neo1 causes an initial HSC expansion.
a Relative expression of Neo1 in the total bone marrow of Wt and Neo1gt/gt mice; n = 6, three independent experiments. b Workflow: generation of full chimeras. c Absolute frequencies of bone marrow CD45.2+ HSCs in full Wt and Neo1gt/gt chimeras 4 months after first and second transplantation; n = 5 (2nd Tx)–8 (Ctrl 1st Tx) and 9 (Neo1 1st TX), two independent experiments. d Workflow: competitive transplantations. e Peripheral blood CD45.2+ chimerism during 1° and 2° competitive transplantations of Wt and Neo1gt/gt bone marrow; n = 13–17 (for exact n/timepoint please see Source data file), three independent experiments, Analysis with two-way ANOVA, multiple comparison with LSD Fisher’s test. f CD45.2+ chimerism of HSCs at endpoints of 1° and 2° competitive transplantations of Wt and Neo1gt//gt bone marrow; n = 11 (2nd TX), 12 (Ctrl 1st Tx), 14(Neo1 1st TX), three independent experiments. Whiskers are min–max, box is 25–75th percentile and line is mean. g Workflow: full chimeras studied in (h). h Absolute frequencies of bone marrow CD45.2+ HSCs in full Wt and Neo1gt//gt chimeras after 8 months; n = 8 (Ctrl)–9 (Neo1), three independent experiments. i Workflow: Homing assay in (j). j Absolute frequencies of CD45.2+ bone marrow LSK cells 48 h after transplantation of 10,000 sorted Wt and Neo1gt//gt LSK; n = 5 (Ctrl)–6 (Neo1). For all panels, ±SD is shown. n indicates biological replicates. P value was determined by two-tailed t test unless stated otherwise. Source data are provided as a Source Data file.

