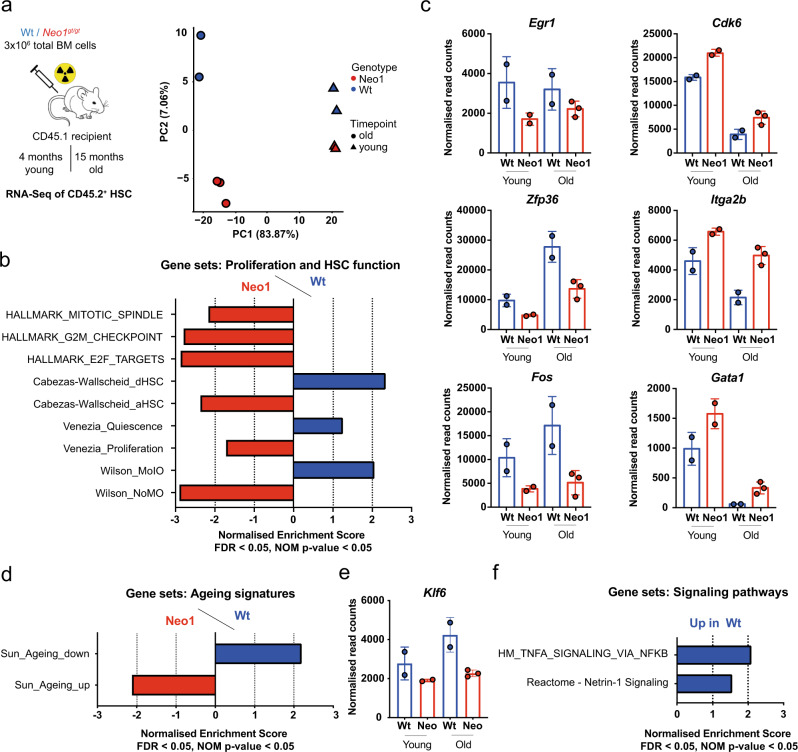
Fig. 4. Neo1-mutant HSCs reveal a loss of quiescence and potency signatures.
a, Left: workflow for RNA-seq of CD45.2+ HSCs from Wt and Neo1gt//gt chimeras after 4 and 15 months. Right: sparse PCA; n = 2 (WT old/young, Neo1 young)–3 (Neo1 old). b GSEA for cell cycle and HSC potency of Wt vs. Neo1gt//gt HSCs. FDR < 0.05, NOM p value <0.05. c Normalized read counts of DEG in HSCs from young and old Wt and Neo1gt//gt chimeras, n = 4 (Ctrl)–5 (Neo1). d GSEA for HSC ageing signatures in Wt vs. Neo1gt//gt HSCs. FDR < 0.05, NOM p value <0.05. e Normalized read counts of Klf6 in HSCs from young and old Wt and Neo1gt//gt chimeras, n = 4 (Ctrl)–5 (Neo1). f GSEA for signalling pathways in Wt vs. Neo1gt//gt HSCs. FDR < 0.05, NOM p value <0.05. For all panels, ±SD is shown. n indicates biological replicates. Scale bars in IF images are 4 μm. P value was determined by two-tailed t test unless stated otherwise. Source data are provided as a Source Data file.

