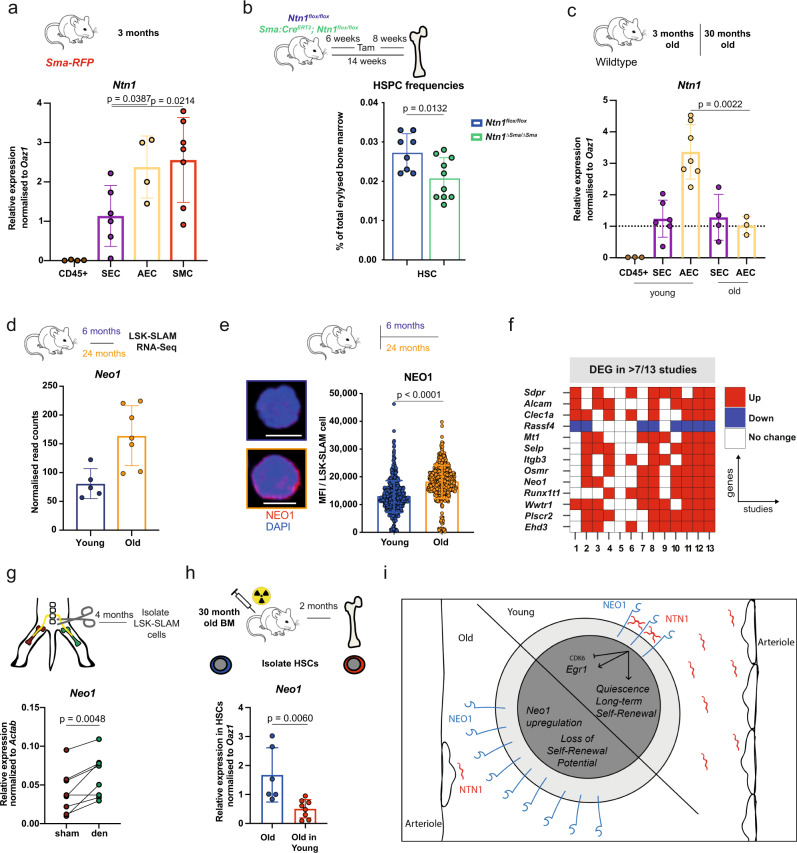
Fig. 7. Loss of niche-derived Ntn1 induces Neo1 in HSC upon ageing.
a Relative expression of Ntn1 in CD45+ cells, SEC, AEC and RFP+ SMC derived from Sma-RFP mice; n = 4 (CD45/AEC), 6 (SEC) and 7 (SMA-RFP), two independent experiments. b Frequencies of HSCs in bone marrow of in Ntn1flox/flox and Ntn1ΔSma/ΔSma mice; n = 8 (flox) and 10 (∆SMA), three independent experiments. c Relative expression of Ntn1 in SEC, AEC and CD45+ cells derived from young and old Wt mice; n = 3 (yCD45/oAEC), 4 (oSEC), 6 (ySEC) and 7 (yAEC), three independent experiments. d Normalized read counts of Neo1 in young, and old LSK-SLAM cells; n = 5 (young) and 7 (old), FDR < 0.0001. e MFI of NEO1 in sorted 6 or 24 months LSK-SLAM cells; n = 592 (young)–593 (old). f Most abundant common DEGs in published ageing studies and own data, additional details in the “Methods” section. g Relative expression of Neo1 in LSK-SLAM cells isolated from either denervated or healthy legs of individual mice; n = 8, two independent experiments. h Relative expression of Neo1 in HSCs of aged mice, before and after 2 months post transplantation; n = 6 (before) and 8 (after), two independent experiments. i Model of Neo1/Ntn1 axis in young and old mice. For all panels, ±SD is shown. n indicates biological replicates. Scale bars in IF images are 5 μm. P value determined by two-tailed t test unless stated otherwise. Source data are provided as a Source Data file.

