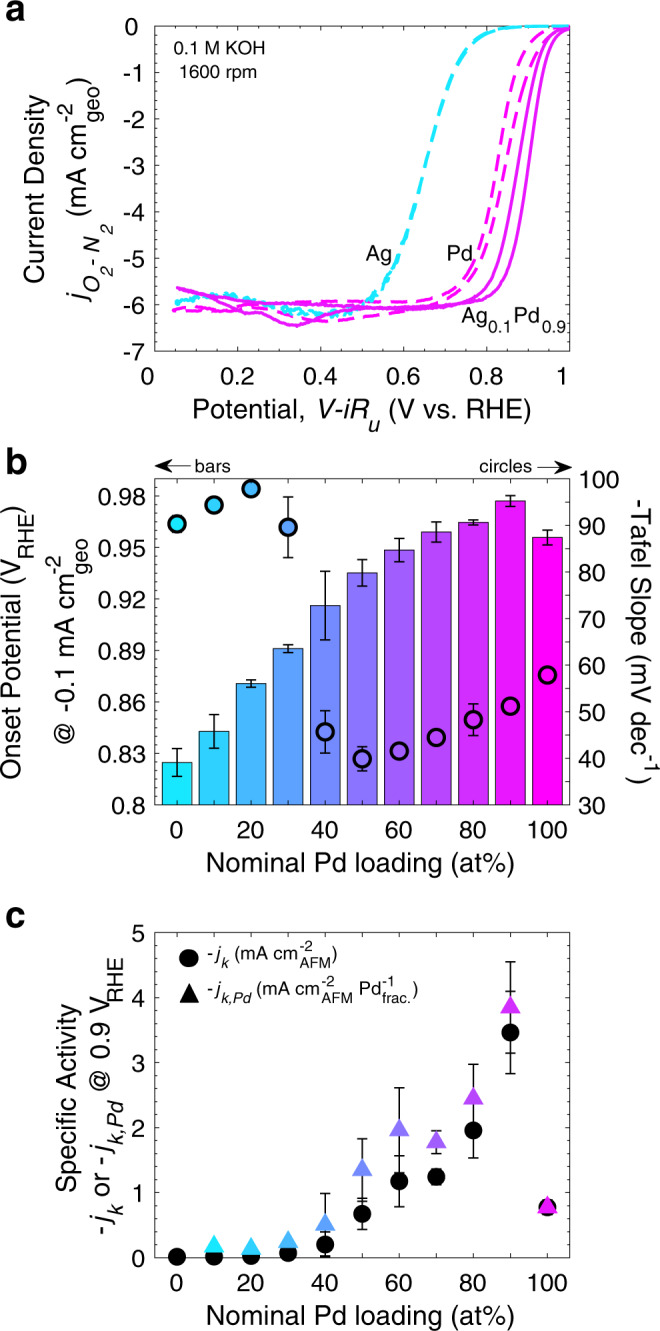
Fig. 2. Electrochemical ORR evaluation of Ag-Pd thin film alloys.

a Select ORR polarization curves for representative Ag, Pd, and Ag0.1Pd0.9 thin films. b Onset potential (bars) (potential at ), Tafel slope (circles), and c specific activity (kinetic current density at 0.9 V vs. RHE normalized by surface roughness determined by AFM) on an absolute (black circles) and Pd fraction-normalized (color-mapped triangles) bases for all Ag1-xPdx compositions investigated. Measurements were taken at 1600 rpm in O2-saturated 0.1 M KOH, have non-ORR current subtracted (from CVs in N2-purged electrolyte), and are corrected for the uncompensated electrolyte series resistance. All data points are representative of the average value from the cathodic and anodic scan of the third CV cycle and error bars are the standard deviation from measurements with separate samples (see Supplementary Figs. 7, 11, 12 and Supplementary Table 3 for representative ORR CV curves, kinetic current densities at 0.9 and 0.8 V vs. RHE, representative Tafel plots, and tabulated data, respectively). The colors refer to the nominal Pd loading, consistent with the text labels in the figure.
