Figure 5.
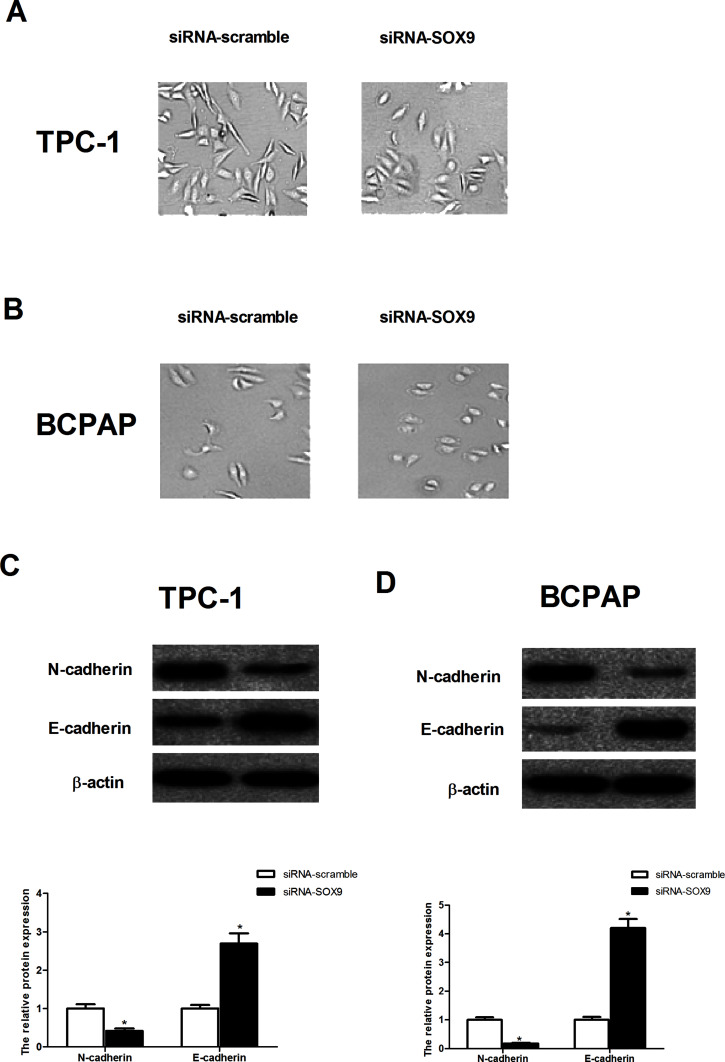
Knockdown of SOX9 reversed EMT phenotype in PTC cells. PTC cells were transfected with siRNA-SOX9 or siRNA-scramble for 24 h. Morphological changes of TPC-1 (A) and BCPAP cells (B) after knockdown of SOX9 expression for indicated groups. (C) The protein expression levels of N-cadherin and E-cadherin were detected by Western blot in TPC-1 cells and quantification of protein levels from three independent experiments. (D) The protein expression levels of N-cadherin and E-cadherin were detected by Western blot in BCPAP cells and quantification of protein levels from three independent experiments. Data represent mean ± SD. *p < 0.05.

