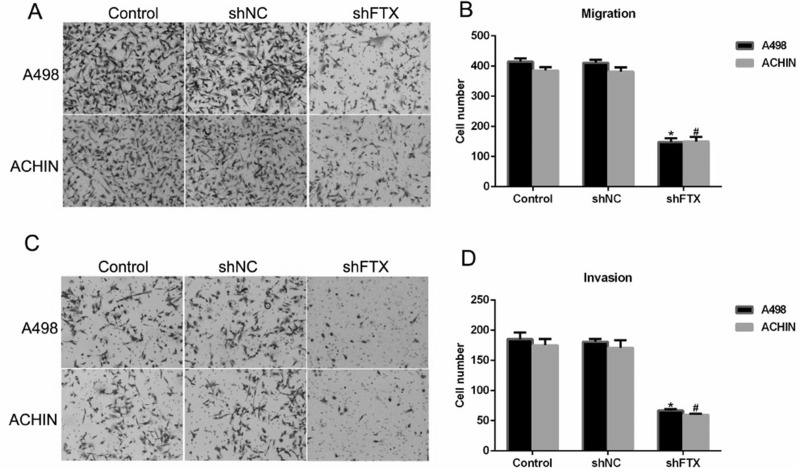
Figure 4.
Knockdown of FTX suppressed cell migration and invasion in RCC cells by Transwell assay. (A) Representative images of cells migrated through the membrane and stained on the lower surface of the membrane in A498 and ACHIN cells. (B) Quantification of cell migration assays revealed FTX depletion with shFTX inhibited the cell migration ability in A498 and ACHIN cells. *p < 0.05 versus Control in A498 cells. #p < 0.05 versus Control in ACHIN cells. (C) Representative images of cells that invaded through the membrane in A498 and ACHIN cells. (D) Quantification of cell invasion assays revealed FTX depletion with shFTX inhibited cell invasion ability in A498 and ACHIN cells. *p < 0.05 versus Control in A498 cells. #p < 0.05 versus Control in ACHIN cells.

