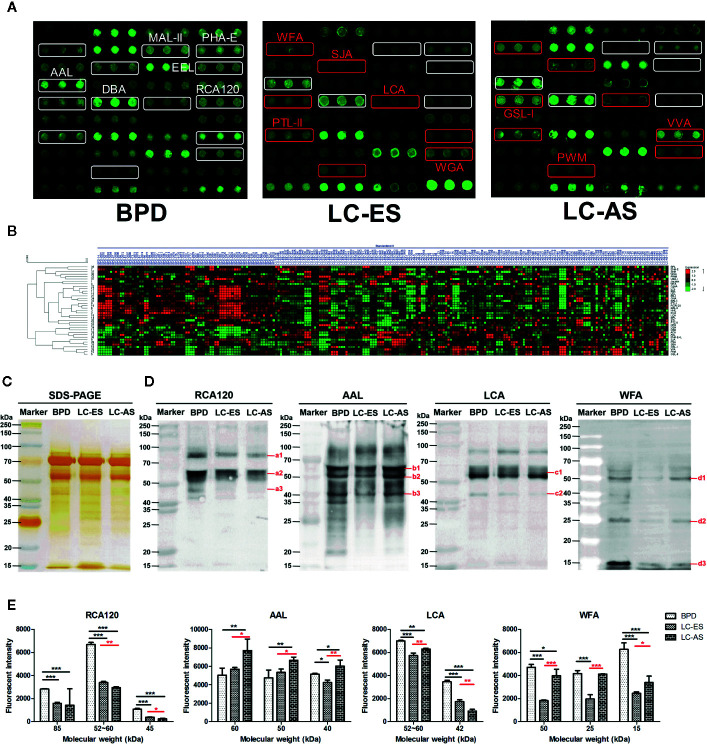
Figure 3.
The different bronchoalveolar lavage fluid (BALF) glycopatterns in benign pulmonary diseases (BPD), early stage lung cancer (LC-ES), and advanced stage lung cancer (LC-AS) using lectin microarray and blotting analysis. (A) The binding profiles of Cy3-labeled BALF glycoproteins bound to the lectin microarrays. The lectin microarrays revealed significant signal differences among BPD, LC-ES, and LC-AS marked with white frames. While the significant differences among LC-ES and LC-AS marked with red frames. (B) Heat map and unsupervised average linkage hierarchical cluster analysis (HCA) of the normalized data of 37 lectins in the 235 BALF samples. Each sample were listed in columns, and the lectins were listed in rows. The color and intensity of each square indicated expression levels relative to the other data in the row. Red, high; green, low; black, medium. (C) SDS-PAGE analysis. (D) Binding pattern profiles of glycoproteins from BALF samples of BPD, LC-ES and LC-AS stained by four Cy5-labeled lectins (RCA120, AAL, LCA, and WFA). Blot affinity results showed 3, 3, 2, and 3 apparent bands belong to different molecular weight ranging from 15 to 250kDa, which were marked as a1-a3, b1-b3, c1-c2, and d1-d3 bound by RCA120, AAL, LCA, and WFA, respectively. a1, 85kDa; a2, 52~60kDa; a3, 45kDa; b1, 60kDa; b2, 50kDa; b3, 40kDa; c1, 52~60kDa; c2, 42kDa; d1, 50kDa; d2, 25kDa; d3, 15kDa. (E) The fluorescent intensities of each band with apparent difference were read by Image J. Those differences were indicated by the p-value (*p < 0.05, **p < 0.01, and ***p < 0.001).

