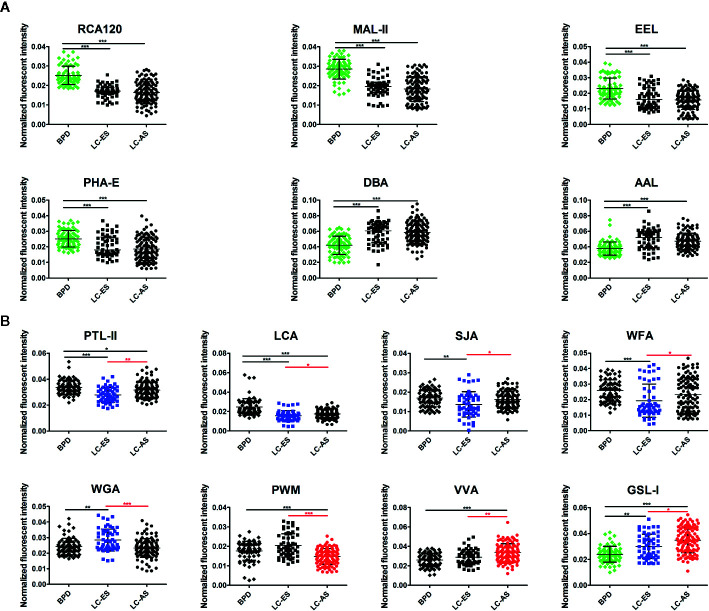
Figure 4.
Scatter plot analysis of the data obtained with the 14 candidate lectins first by Kruskal-Wallis test, followed by a Dunn’s Multiple Comparison Test. (A) The difference of bronchoalveolar lavage fluid (BALF) glycopatterns between benign pulmonary diseases (BPD) and LC (including different stages) marked with black. (B) The difference between early stage lung cancer (LC-ES) and advanced stage lung cancer (LC-AS) marked with red. Those differences was indicated by the p-value (*p < 0.05, **p < 0.01, and ***p < 0.001).

