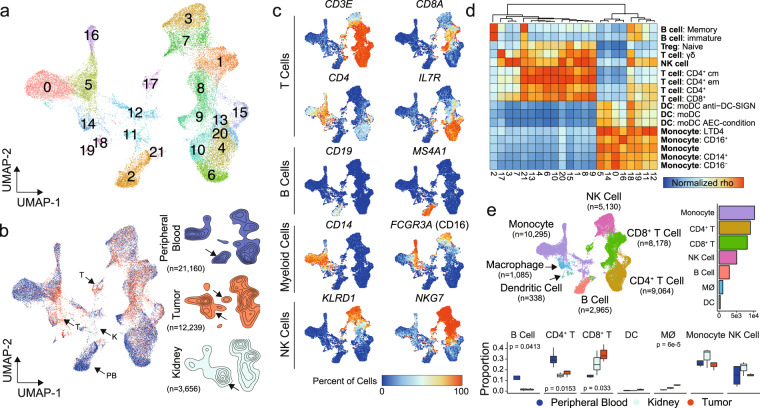
Fig. 1. Single-cell RNA sequencing results from immune cells in ccRCC.
a UMAP of 37,055 primary immune cells of peripheral blood, normal renal parenchyma and tumor-infiltrating ccRCC patients. b Distribution of cells by tissue type, peripheral blood (blue), tumor (red), and kidney (light blue). Arrows indicated potential enriched or unique immune cells populations for tissue type. c Percent of cells expressing canonical immune cell markers across the UMAP. d Normalized correlation values for predicted immune cell phenotypes based on the SingleR R package for each cluster; dendrogram based on Euclidean distance. e UMAP demonstrating inferred immune cell types in ccRCC, clusters are colored by cell type and proportion of single-cell per sequencing run by tissue type. P values based on one-way ANOVA; lack of labeled p values equates to value >0.05.

