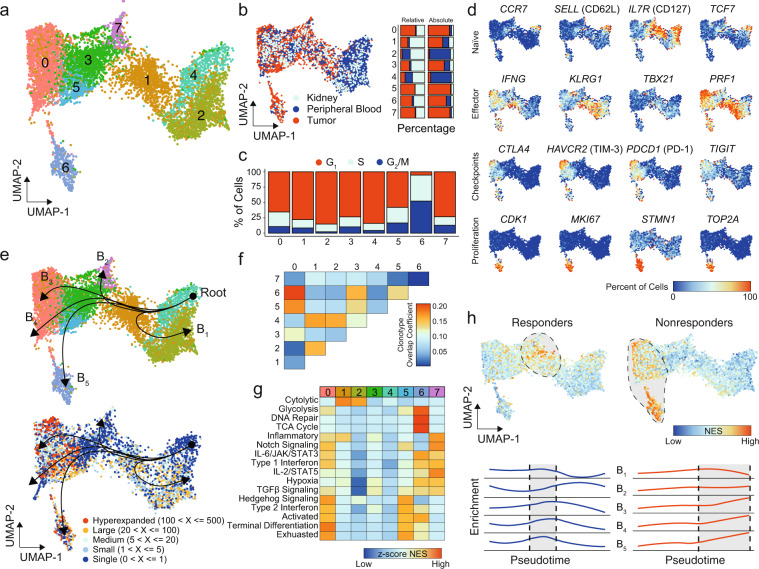
Fig. 3. CD8+ T cells in ccRCC tumors exhibit a transcriptional continuum with distinct populations.
a UMAP subclustering of CD8+ T cells (original clusters 1, 8, 9, and 17). b UMAP distribution of single cells by tissue type with relative and absolute percent of cells by tissue in each cluster. c Cell-cycle regression assignments for CD8+ T cells by cluster assignment. d Percent of cells expressing selected markers for T-cell biology. e CD8+ UMAP of clusters (upper panel) and clonotype frequency (lower panel) overlaid with slingshot-based36 cell trajectory starting at CD8_4 and proceeding into five distinct curves: branch 1 (B1), B2, B3, B4, and B5. f Clonotype overlap coefficients between subclusters. g Z-transformed normalized enrichment scores from ssGSEA for selected gene sets by subcluster. h Normalized enrichment scores for therapeutic response or lack of response to anti-PD-1 therapy across the CD8+ T cells (upper panel) and by pseudotime of each branch (lower panel).

