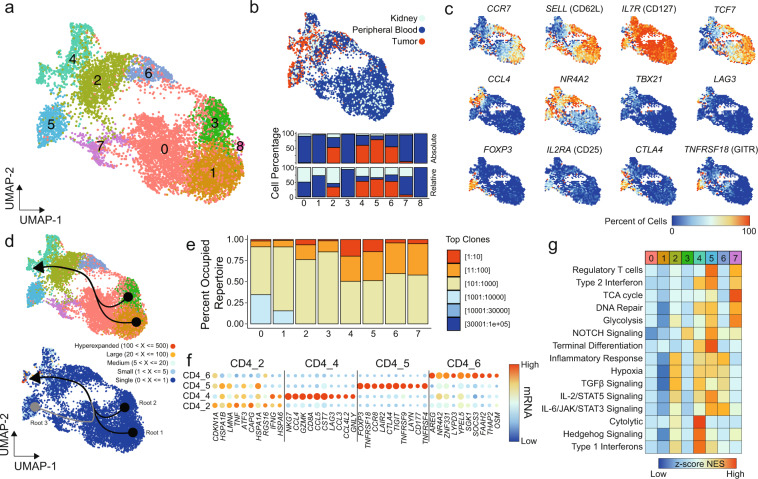
Fig. 4. Single-cell CD4+ T-cell characterization within ccRCC.
a UMAP subclustering of CD4+ T cells (original clusters 4, 6, 10, 13, 15, and 20). b UMAP distribution of single cells by tissue type with relative and absolute percent of cells by tissue in each cluster. c Percent of cells expressing selected markers for T-cell biology. d CD4+ UMAP of subclusters (upper panel) and clonotype frequency (lower panel) overlaid with slingshot-based36 cell trajectory starting from CD4_1 (root 1) and CD4_3 (root 2) with relative pseudotime for all curves calculated using slingshot. e Occupied repertoire space for CD4+ subclusters. f Top ten markers for TI-predominant CD4+ subclusters. Size of points are relative to percent of cells in the subcluster expressing the indicated mRNA species. g Z-transformed normalized enrichment scores from ssGSEA for selected gene sets by subcluster.

