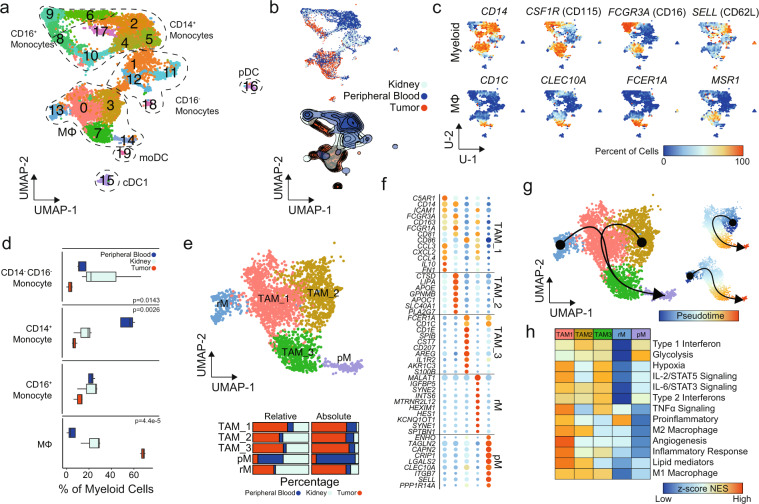
Fig. 5. Single-cell myeloid characterization in ccRCC.
a UMAP subclustering of myeloid cells (original clusters 4, 6, 10, 13, 15, and 20). b UMAP distribution of single cells by tissue type with relative percent of cells by tissue in each cluster. c Percent of cells expressing selected markers for myeloid and macrophage markers. P values derived from one-way ANOVA testing. d Proportion of assigned cell types compared to total antigen presenting cells by tissue type. e Macrophage subclusters: tumor-associated macrophage 1 (TAM_1) (n = 1262), TAM_2 (n = 840), TAM_3 (n = 594), peripheral macrophage (pM) (n = 275), and resident macrophage (rM) (n = 194) with relative and absolute percent of cells by tissue in each cluster. f Top differential expression markers for macrophage subclusters. g Macrophage UMAP overlaid with slingshot-based36 cell trajectories starting at rM and TAM_2 and proceeding into pM. Smaller UMAP shows pseudotime created by the cell trajectories. h Z-transformed normalized enrichment scores from ssGSEA for selected gene sets by subcluster.

