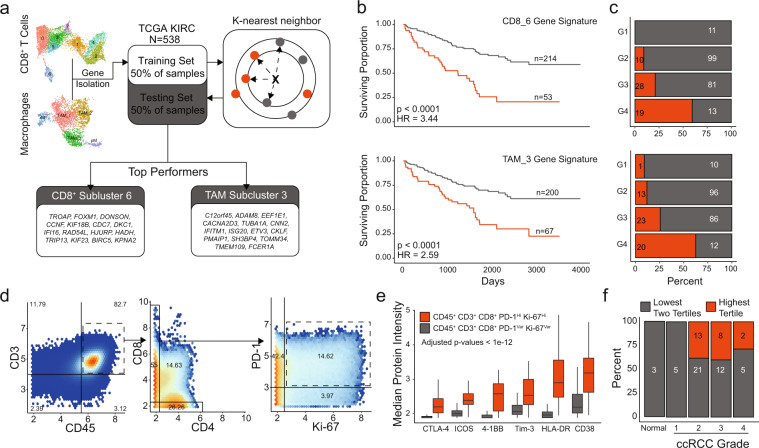
Fig. 6. Prognostic values of gene signatures derived from CD8+ T cell and TAM subclusters.
a Schematic diagram of the machine-learning approach for signature development, selection and testing based on the k-nearest neighbors algorithm using the TCGA renal clear cell carcinoma data set. b Kaplan–Meier curves for overall survival in testing subset for the CD8_6 subcluster signature with corresponding distribution of histological grades by model assignment. c Kaplan–Meier curves for overall survival in testing subset for the TAM_3 subcluster signature with corresponding distribution of histological grades by model assignment with logrank p values. d Density plots for 937,713 T cells isolated from four healthy samples, 68 primary ccRCC, four metastasis, and quantified using mass cytometry18. e Markers with increased median expression in CD45+ CD3+ CD8+ PD-1+ Ki-67+ cells compared to other CD8+ cells. Adjusted p values < 1e−12 for all indicated markers using Welch’s T test. f ccRCC primary tumor and healthy samples subdivided into tertiles by the proportion of CD45+ CD3+ CD8+ PD-1+ Ki-67+ relative to the entire CD45+ CD3+ CD8+ pool by histological grade.

