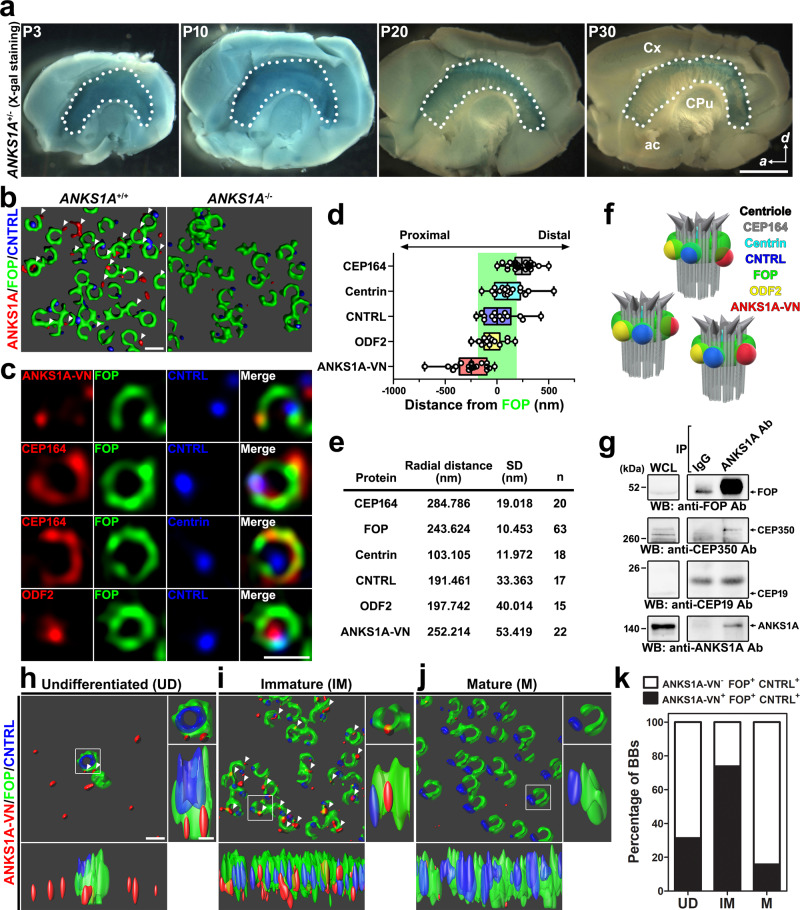
Fig. 1. Specific localization of ANKS1A to FOP-positive SDAs.
a LWs (marked by dotted lines) with other forebrain tissues were subjected to X-gal staining. Scale bar, 500 μm. Cx cortex, CPu caudate putamen, ac anterior commissure. b The LWs were co-stained with ANKS1A, FOP, and CNTRL antibodies. The 3D SIM images were analyzed by the Imaris software. c 3DSIM micrographs of representative BBs. ANKS1A-VN was injected into the LV at E16.5 and subjected to in utero electroporation. The LWs at P4 were then co-stained for FOP and various BB markers with antibodies. Scale bar for b, c, 500 nm. d A median line and upper and lower quartile are presented in box and whisker plot of the axial distances of BB proteins from immature E1 cells. CEP164, n = 24; Centrin, n = 19; CNTRL, n = 14; ODF2, n = 15; ANKS1A-VN, n = 18. A green-shaded box marks a FOP-stained region brighter than 30% of the maximum intensity. e Table showing the radial distances of BB proteins from immature cells. The center of the FOP-positive ring image was used as a reference for the radial distances of BB proteins; n indicates the number of BBs used for statistical analysis. SD standard deviation. f Cartoon depiction of the BB proteins shown in d, e. g Whole-cell lysates (WCL) were prepared from six LWs at P4 and then the protein complexes were precipitated with the C-terminal specific antibody to detect the ANKS1A-associated proteins. h–j 3DSIM micrographs of BBs in E1 cells representing three different developmental stages. White arrowheads mark ANKS1A-VN present in FOP-stained SDAs. Scale bar for h–j, 500 nm. k Data shown in h–j were quantified with the total number of the double-positive FOP+CNTRL+ BBs set to 100%. Then the percentage of triple-positive ANKS1A+FOP+CNTRL+ BBs was calculated. Undifferentiated (UD), n = 67; immature (IM), n = 195; mature (M), n = 227 where n indicates the number of BBs analyzed.

