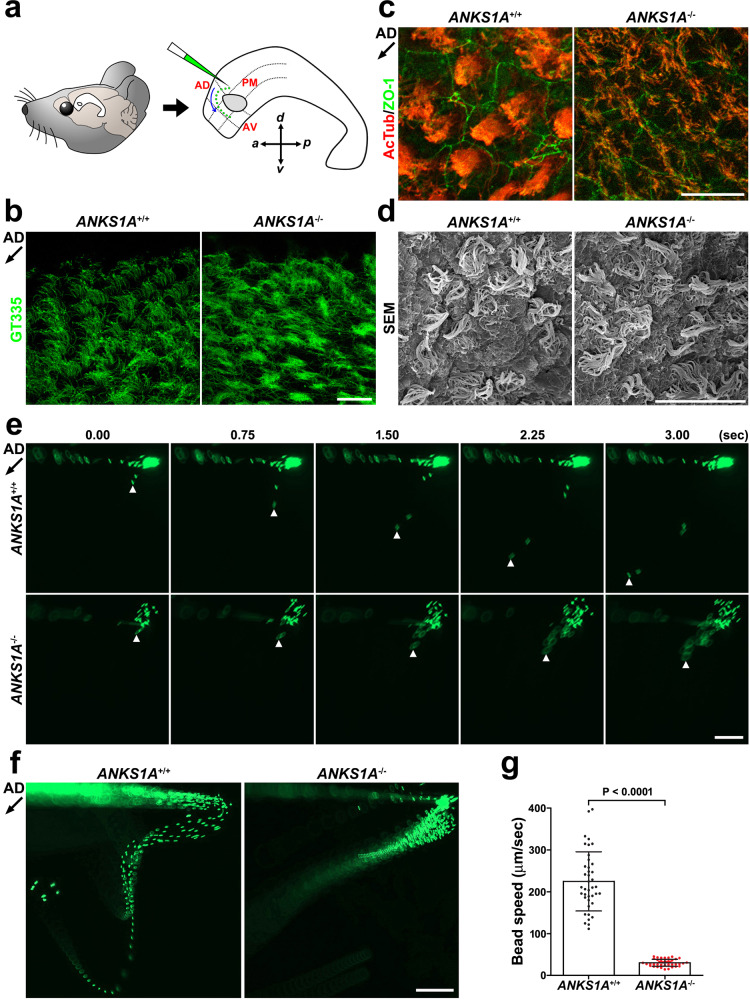
Fig. 3. ANKS1A loss results in uncoordinated beating of motile cilia.
a Schematic of LWs showing three regions around the adhesion area (marked by a circle) or the movement of fluorescent beads (green) on a live LW. AD anterior–dorsal, AV anterior–ventral, PM posterior–medial. b, c Whole-mount staining of LWs using GT335 (glutamylated tubulin) or AcTub (acetylated tubulin) antibodies at P20. The black arrow (~225°) indicates the direction of CSF flow in the AD region. The abnormal phenotype of KO ependymal cilia was observed from at least five different pairs of WT and KO littermates. Scale bar for b, c, 20 μm. d SEM analysis of LWs from littermates at P30. Scale bar, 20 μm. This result was reproducibly observed from at least three different pairs of WT and KO littermates. e High-speed video imaging analysis of the same fluorescent bead at different time points. f Thirty-five consecutive frames of Supplementary Movie 1 were merged into a single picture. Scale bar for e, f, 200 μm. g Data presented in d were used to calculate an average bead speed based on at least three independent experiments. Data represent mean ± S.D. Each point on the graph represents the speed of an individual bead.

