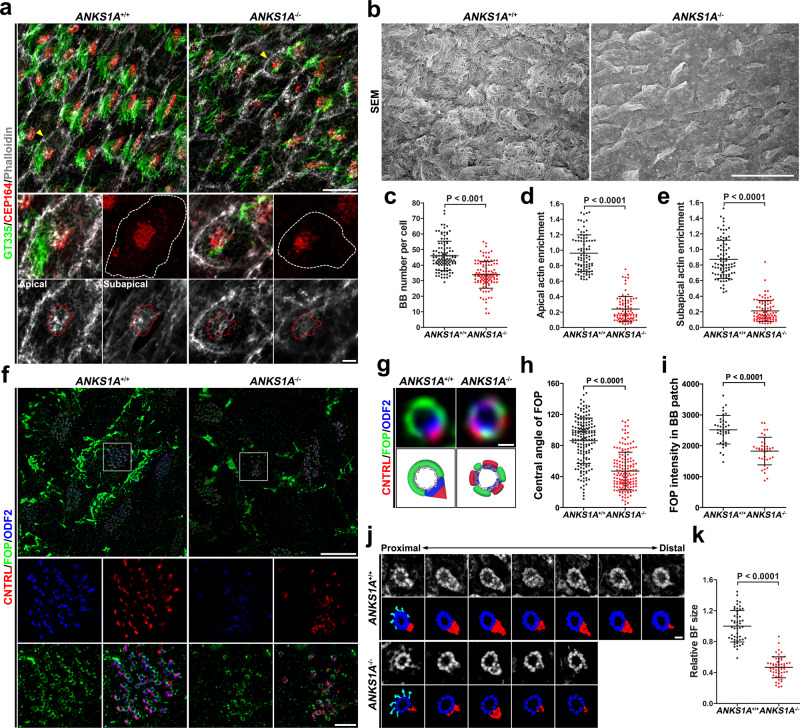
Fig. 6. ANKS1A loss results in severe SDA degeneration in aged mice.
a Confocal microscopic analysis of LWs from littermates at 22 months of age (top panels). A representative cell (marked by yellow arrowheads) in each panel is enlarged to reveal motile cilia (green), BBs (red) (middle panels), and F-actin (gray) at the apical and subapical levels (bottom panels). The cell border and actin network around a BB patch are outlined with white and red dotted lines, respectively. b An SEM analysis of LWs from littermates at 22 months of age. Scale bar for a, b, 10 μm. c–e Data from a were quantified. The mice used for this quantification ranged from 18 to 22 months of age. For c: ANKS1A+/+ set, n = 110 cells from 4 mice; ANKS1A−/−, n = 113 cells from 4 mice. For d, e: ANKS1A+/+ group, n = 87 cells from 4 mice; ANKS1A−/−, n = 85 cells from 4 mice. f 3DSIM micrographs of LWs depict triple staining with FOP, ODF2, and CNTRL. White boxes indicate the regions of ×3 magnification that reveal SDA staining with each antibody (second and third panels). Scale bar, 10 μm. g Representative SDA images (top) together with their cartoon depiction (bottom). Scale bar, 200 nm. h The central angles were calculated. ANKS1A+/+ set, n = 164 BBs from 3 mice; ANKS1A−/−, n = 160 BBs from 3 mice. i Data in f were quantified. Data represent mean ± SD. ANKS1A+/+ group, n = 50 cells; ANKS1A−/−, n = 56 cells. j, k A ribbon of consecutive sections (50 nm) was placed on a one-hole grid and subsequently analyzed by TEM. The resulting micrographs were aligned to measure the overall BF size. Data represent mean ± SD. ANKS1A+/+ set, n = 50 BBs; ANKS1A−/−, n = 54 BBs. Scale bar, 100 nm.

