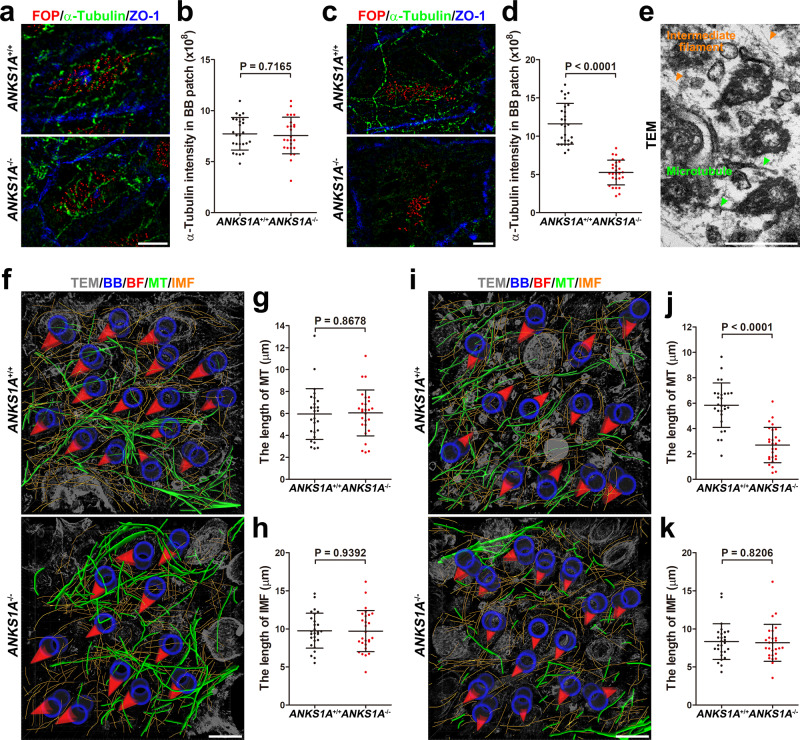
Fig. 7. ANKS1A deficiency results in a marked loss of the microtubule network in aged mice.
a–d 3DSIM images of the MT networks stained with alpha-tubulin antibody for both young (P45) and aged (20-month old) mice. a, b ANKS1A+/+ set, n = 6 cells from 2 mice; ANKS1A−/−, n = 5 cells from 2 mice. c, d ANKS1A+/+ set, n = 9 cells from 3 mice; ANKS1A−/−, n = 9 cells from 3 mice. Scale bar for a, c, 5 μm. e A representative TEM image illustrating the intermediate filament and microtubule. Scale bar, 500 nm. f–j 3D reconstruction of the microtubule and intermediate lattice. The image of the microtubules (green) and intermediate filament (orange) was reconstructed and superimposed on a single plane. For g, h (P45 mice), ANKS1A+/+ set, n = 10 cells from 2 mice; ANKS1A−/−, n = 10 cells from 2 mice. For j, k (20-month-old mice), ANKS1A+/+ set, n = 9 cells from 2 mice; ANKS1A−/−, n = 9 cells from 2 mice. Scale bar for f, i, 500 nm.

