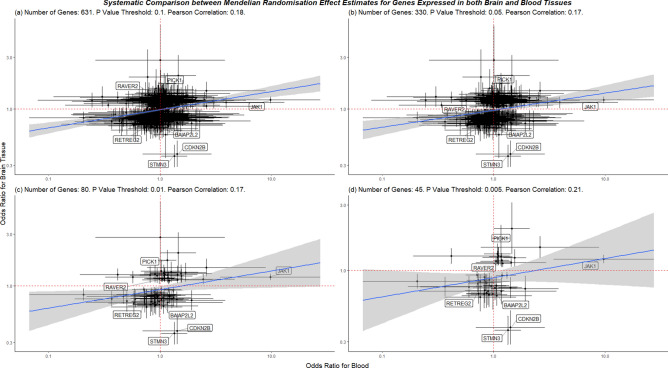
Figure 4.
Systematic comparison between the MR results from brain tissues and blood. Any eQTL that appeared in both brain and blood datasets was included in this analysis. We plotted the odds ratios for blood against brain, deciding which results to include based on a P value cut-off: (a) P < 0.1, (b) P < 0.05, (c) P < 0.001 and (d) P < 0.005. Labels are provided for genes which had an association that passed at least the suggestive P value threshold (P < 9.49 × 10⁻⁵).

