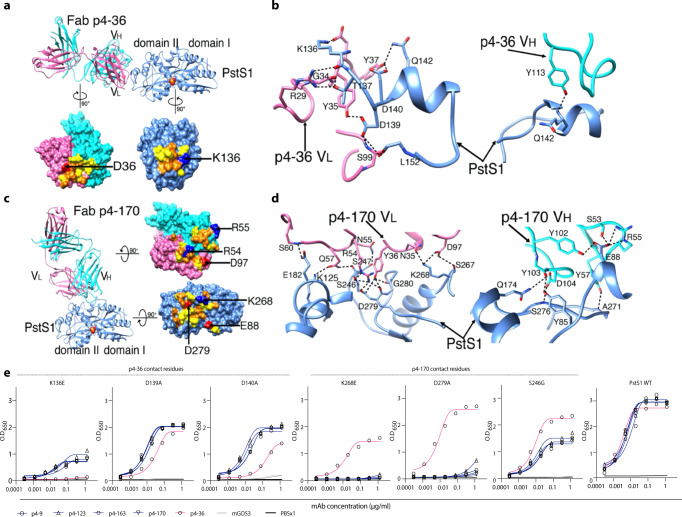
Fig. 4. MAbs p4–170 and p4–36 recognize different epitopes on top of PstS1.
a Top: Ribbon diagrams show the crystal structure of PstS1 in a complex with Fab p4–36 (PDB ID 7DM1). The Fab p4-36 heavy and light chains are colored cornflower cyan and hot pink, respectively. The PstS1 structure is colored blue. The bound phosphate (Pi) is represented as filled balls with oxygen and phosphorus atoms colored red and yellow, respectively. Bottom: an open-up surface-shadowed representation showing the contact interface. Residues involved in hydrogen bonds and Van der Waals contacts are highlighted in orange and yellow, respectively. Positively and negatively charged residues involved in the formation of the salt bridges are highlighted in blue and red, respectively. b Close-up view of the interface between PstS1 and Fab p4-36. The dashed lines indicate hydrogen bonds and salt bridges. c Left: Ribbon diagrams show the crystal structure of PstS1 in complex with Fab p4-170 (PDB ID 7DM2). Right: An open-up surface-shadowed representation showing the contact interface. The color schemes used are the same as in (a). d Close-up view of the interface between PstS1 and Fab p4-170. The dashed lines indicate hydrogen bonds and salt bridges. e Four Clone 1 variants (mAbs p4-9, p4-123, p4-163, and p4-170, dark blue), and mAb p4-36 (magenta), as well as negative control mAb mGO5320 (gray), were tested for binding by ELISA to six-point mutant PstS1 proteins. The binding curves of PstS1 mutated in p4-170 contact residues K268E, D279A, and S246G, as well as the PstS1-mutated p4-36 contact residues K136E, D139A, and D140A are shown. The binding curves to wild-type PstS1 are shown in the right panel of the figure.

