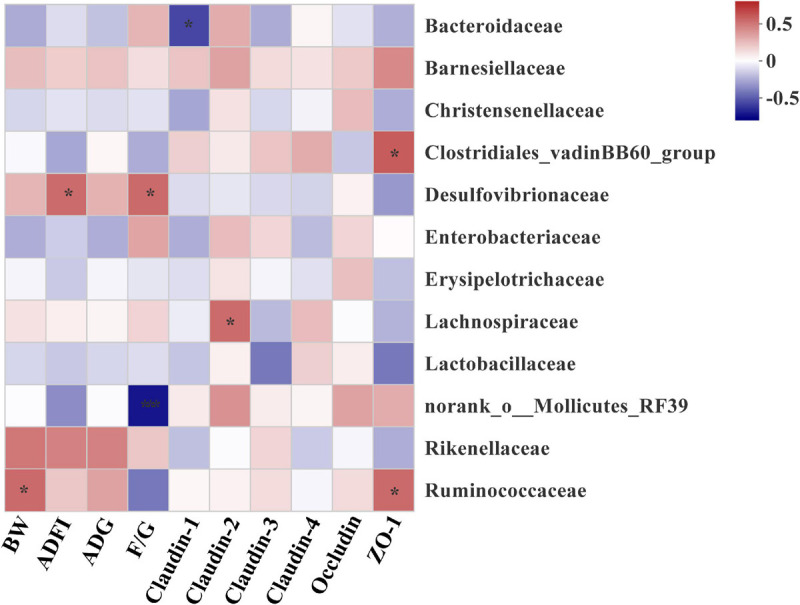
FIGURE 8.

Heatmap of spearman’s correlation between intestinal microbiota at family level and growth performance and tight junction protein mRNA expressions of broilers on day 42. The colors range from blue (negative correlations) to red (positive correlations). Significant correlations are noted by 0.01 < P ≤ 0.05*, 0.001 < P ≤ 0.01**. BW, body weight; ADG, average daily gain; ADFI, average daily feed intake; F/G, feed conversion ratio (feed: gain, g: g); ZO-1, Zonula occludens-1.
