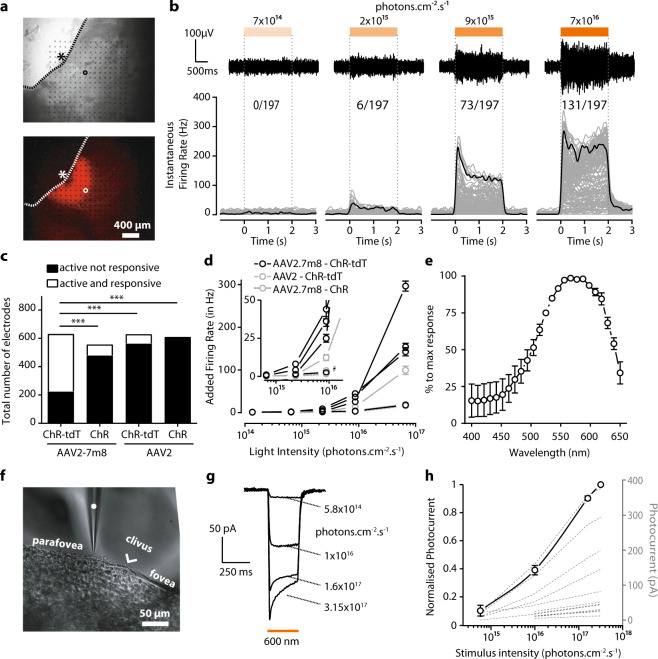
Fig. 1. Higher transfection efficiency with AAV2.7m8–ChR-tdT in NHP retinas.
a Images of a primate retina expressing AAV2.7m8–ChR-tdT as observed during MEA recordings. Top: Infrared image, electrodes can be seen as black dots; the retina explant in gray, and its limit is shown as a dashed line. An asterisk indicates the center of the fovea, the circle indicates the example electrode in b. Bottom: Epifluorescence image of the same piece of the retina. The strong perifoveal expression can be observed in the mounted hemifovea thanks to tdT fluorescence. b, top: Raw signal recorded from one sample electrode (circled electrode in a) in response to stimuli of increasing intensities (7 × 10¹⁴, 2 × 10¹⁵, 9 × 10¹⁴, and 7 × 10¹⁶ photons cm−2 s−1). Light to dark orange rectangles indicate the temporal duration (2 s) of the different intensities of light stimulation delimited by dashed vertical lines. Voltage and temporal scale on the left (bottom) Spike density function for all the active electrodes of the hemifovea shown in a (gray lines, n = 197 lines) as a function of time, before, during, and after a two-second stimulus. Firing rates were averaged over ten repetitions. Black lines show the mean firing rate for the electrode displayed in the upper panels and circled in a. The numbers at the top indicate the number of responsive electrodes per light intensity compared to total active electrodes (i.e., electrodes where spikes are recorded). c Total of active electrodes recorded for the four different constructs (four experiments per construct, theoretical maximum: 1024 electrodes per construct). Data are then split for each construct between active and responsive electrodes (white) and active but unresponsive electrodes (black). The proportion of active and responsive electrodes is maximal for AAV2.7m8–ChR-tdT (n = 4, Fisher contingency test, P < 0.0001). d Mean additional firing rate per responsive retina for the four constructs ± SEM (four responsive retinae for AAV2.7m8–ChR-tdT, two for AAV2–ChR-tdT, one for AAV2.7m8–ChR, zero for AAV2–ChR). Stimulation at 590 nm ±15 nm. The inset shows a zoomed image around the first responsive intensity: 2.34 × 10¹⁵ photons cm−2 s−1. e Mean normalized action spectrum for three retinas expressing AAV2.7m8–ChR-tdT ± SEM. f Infrared image of the perifoveal region from a retina treated with AAV2.7m8–ChR-tdT and recorded by two-photon targeted patch clamp. The patch-clamp electrode is indicated with a white asterisk, the clivus ocularis is indicated, separating the fovea from the parafovea. g, h Whole-cell patch-clamp recordings of ChR-tdT-expressing macaque perifovea neurons. g Photocurrent traces from one recorded cell at different light intensities. h ChR-induced photocurrents peaks are represented as a function of light intensity for each individual recorded cell (dashed lines, n = 17), the solid line represents the population-averaged photocurrent after normalization to maximal peak value + /− SEM. Light stimulation intensity ranged from 5.8 × 10¹⁴ to 3.2 × 10¹⁷ photons cm−2 s−1.

