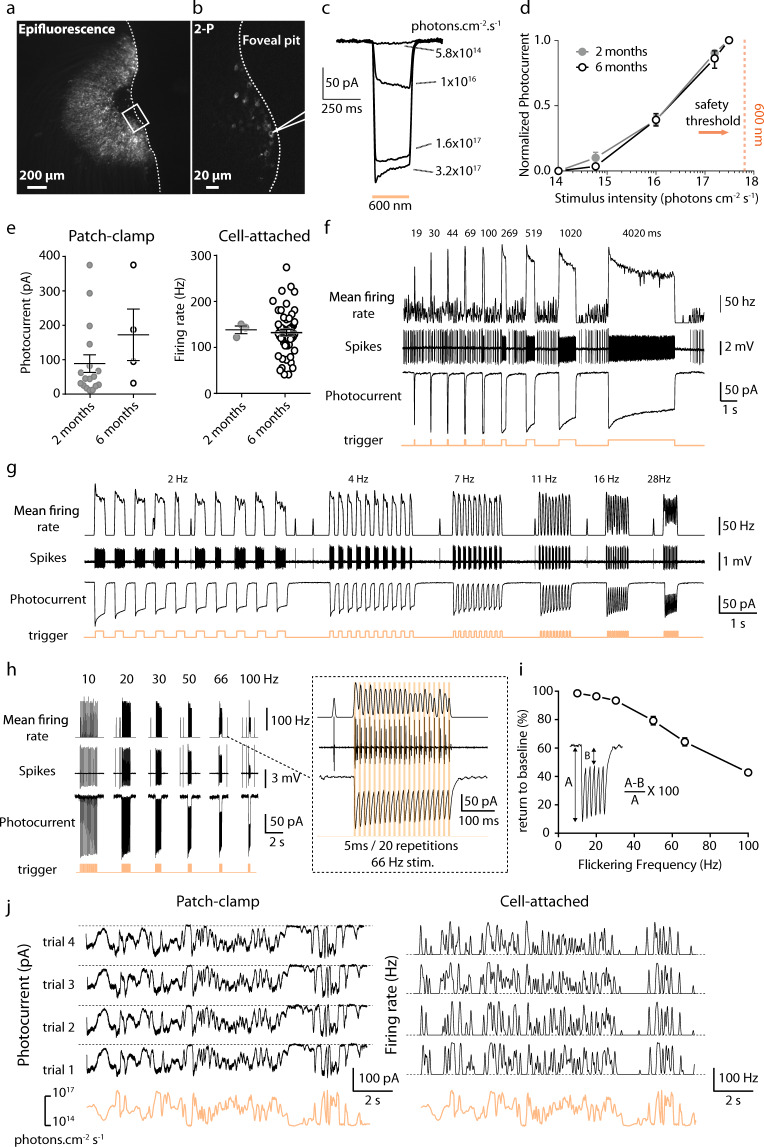
Fig. 4. Long-term stable expression of ChR-tdT allows reliable spike train generation at high temporal resolution.
a Epifluorescence image showing tdT-expressing RGCs in the perifoveal region of a monkey 6 months after injection of AAV2.7m8–ChR-tdT at 5 × 10¹¹ vg/eye. Limit of the retinal explants displayed as a dashed line. b Two-photon laser imaging of the foveal pit. The scanned zone is presented as a rectangle in a; the outline of the patch-clamp electrode is visible in the vicinity of a ChR-tdT-positive cell. c Photocurrent responses of a representative cell to different light intensities (5.8 × 10¹⁴ to 3.2 × 10¹⁷ photons cm−2 s−1), obtained by patch-clamp recording. d Plot of mean normalized photocurrent ± SEM response against irradiance at 600 nm ± 10 nm in ChR-tdT-expressing RGCs following the injection of 5 × 10¹¹ vg/eye (n = 17 for 2 months, n = 4 for 6 months). The orange dashed vertical line indicates the safety threshold at 600 nm (6 × 10¹⁷ photons cm−2 s−128, 29). e Peak photocurrent (left) and maximum firing rate (right) in ChR-tdT-expressing RGCs for the two durations of expression, 2 and 6 months (photocurrent: 88.7 ± 25.5 pA, n = 17 represented by closed gray circles and 172.4 ± 74.9 pA, n = 4 represented by open white circles, respectively, P = 0.155; firing rate: 138.3 ± 8.4 Hz, n = 3 and 132.3 ± 7.2 Hz, n = 50, respectively, P = 0.669). Long horizontal black lines indicate the mean ± SEM. f, top: Mean firing rate in response to stimuli of increasing flash duration (19–4020 ms) obtained in cell-attached configuration aligned with the trigger of the flash appearance (orange bottom line). f, middle: Raw data showing the recorded spikes in the cell-attached configuration. f, bottom: Photocurrents recorded in the same cell during the presentation of the same pattern of stimuli in the whole-cell configuration. g Firing frequency (top), spike trains (middle), and photocurrent response (bottom) of the same cell to increasing stimulus frequency in a full duty cycle (from 2 to 30 Hz). h left: Firing frequency (top), spike trains (middle), and photocurrent response (bottom) of the same cell to increasing stimulus frequency, for short light stimulation pulses (trains consisting of 20 repeats of a 5 ms stimulus), at 10–100 Hz. h, right: Close-up of the left panel showing responses to 5 ms stimuli presented at 66 Hz (20 repetitions). The RGC follows precisely the stimulus by firing distinct action potential doublets at every pulse. i Inactivation of the photocurrent, as observed in (h), as a function of stimulation frequency. For every cell recorded (n = 7), we measured the percentage return to the current baseline (averaged across the 20 stimulations), for stimuli of 2–100 Hz. For stimulations at 10, 66, and 100 Hz, cells returned to (mean ± SEM): 98.6 ± 0.4%, 64.4 ± 2.9 %, and 42.8 ± 1.8% of their initial baseline values, respectively. For panels e–hi, the light intensity used was 3.2 × 10¹⁷ photons cm−2 s−1 at 600 nm ± 10 nm. j Representative example of the photocurrent response (left) and firing frequency (right) of a single cell, demonstrating high reliability across trials (n = 4) for both current and firing activity, during stimulation of the cell with a randomized oscillating stimulus intensity ranging from 3 × 10¹⁴ to 3 × 10¹⁷ photons cm−2 s−1 (orange lines). The dashed line illustrates 0 pA (left) or 0 Hz (right).

