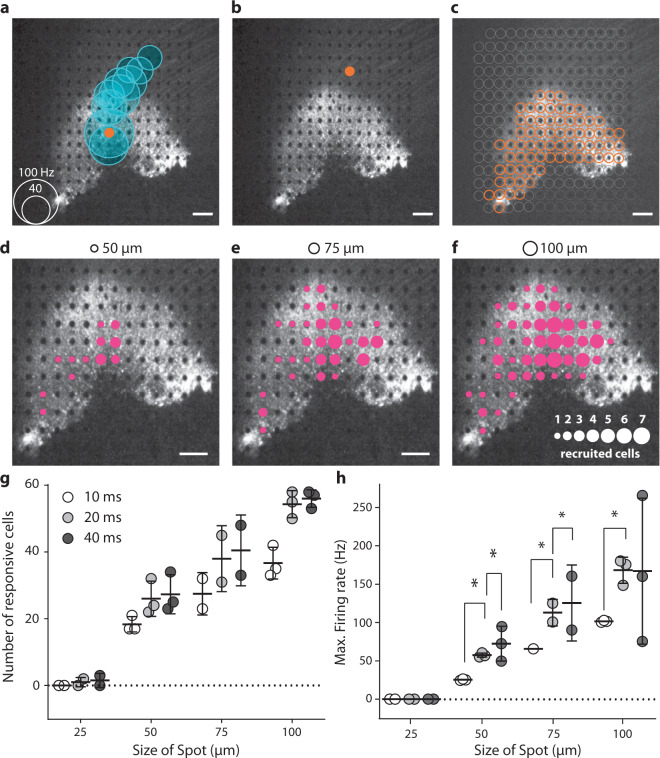
Fig. 5. Spatiotemporal resolution for discrete stimulation.
a A focal light stimulation activated several different electrode channels on the transfected perifoveal area. The black and white image shows the fluorescence present in the perifovea area, with electrodes visible as black dots The orange dot shows the site of light stimulation (with a diameter of 100 µm and a duration of 40 ms spots. The blue circles are centered on the channels for which spikes were recorded suggesting a strong propagation activity. The size of the blue circles is proportional to the maximum spiking rate within a 100 ms window after stimulation, according to the scale in the bottom left corner. b When the light spot is directed toward another electrode at a location at which the RGC axons were stimulated, rather than the soma as in a; no response was measured (absence of blue circles). c Orange dots represented the sites at which stimulation resulted in a spiking response recorded on at least one MEA channel. These locations exactly match the pattern of intense fluorescence in the perifoveal area. d–f Images showing the extent of responses for 20 ms presentations of spot stimuli of different sizes (displayed at the top of the images). The sizes of the magenta circles indicate the numbers of cells activated by a spot at that particular position (see the scale in the lower right part of the panel). For a–f, scale bars indicate 200 µm. g, h Total number of recorded cells (g) and mean firing rate (h) over the entire electrode array is highly correlated with spot size and duration. For all stimulus durations (10 ms, 20 ms, and 40 ms), the increase in size from 25 to 50 µm, 50 to 75 µm, and 75 to 100 µm led to a significant increase in the firing rate of the cells, not shown on the figure (all P < 0.005, n = 3, see “Methods” for details); for increases in duration for single spot size, the results of statistical analyses are displayed on the figure.

