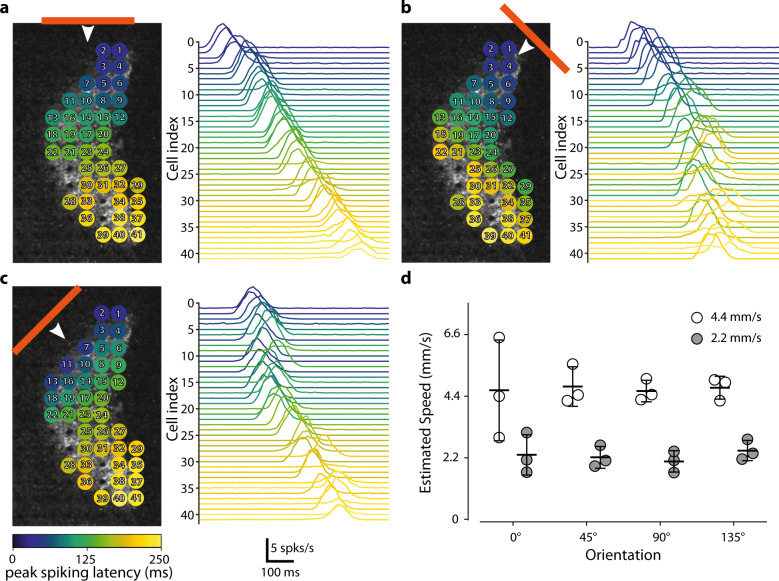
Fig. 6. The measured activity is sufficient for estimation of the speed and direction of a moving bar.
a Various responses of the individual cells to a horizontal bar moving (75-µm long represented by the horizontal orange line moving at 2.2 mm/s downwards as indicated by the white arrow) across a transfected retina. The various cells recorded are represented in the panel on the left. The colors indicate the times at which peak spiking activity occurred for each cell relative to the earliest cell activation peak for the motion of the bar. The right panel shows the mean firing plots for all the recorded cells. The cells are ordered according to peak spiking latency. b, c As in a but with other two moving bar directions (45° for b and 135° for c). The cell index was retained. d A simple plane fitting-based method predicted the relative speed of the bars presented at either 2.2 mm/s or 4.4 mm/s (n = 3).

