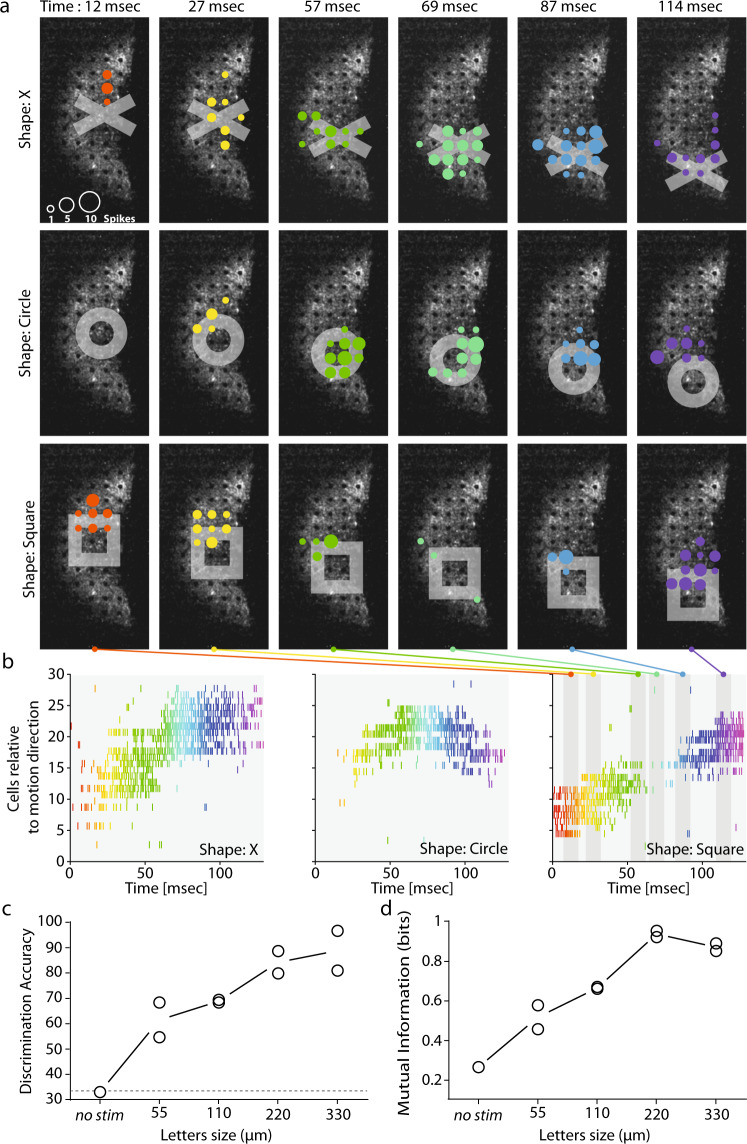
Fig. 7. The measured activity can be used to discriminate stimulation with different shapes and to predict visual acuity.
a Responses of cells to three different shapes (rows: X, circle and square, columns: six different times) moving from the center towards the bottom of the retina. The colored disks indicate the electrodes where cells are recorded spiking. The size of the disks show the number of spikes detected in a 10-ms time window centered on the time indicated at the figure top. Color of the disks changes with timing in the sequence. b Raster plots showing the activity of the cells over time. The three shapes (X: left, circle: center and square: right) triggered different patterns of activity in the cell population. Color of the action potential on the raster change with time, fitting the color code in a. The six different time windows used in a are shown as the gray area over the right panel (square). c Discriminability (as a %) of the features of the spatiotemporal spike response obtained from population spike trains for different sizes. Discriminability increased with letter size. “No-stim” discrimination was performed with the spontaneous activity pattern just before the start of stimulation. The no-stim discrimination rate was about 33%, as would be expected by chance alone for three shapes. d Normalized mutual information from the confusion matrix obtained from the discrimination rates in (c). The information tends to increase with the size of the shapes, with saturation occurring at 220 µm. The information and discriminability at 220 µm indicate a visual acuity above the defined threshold for legal blindness.

