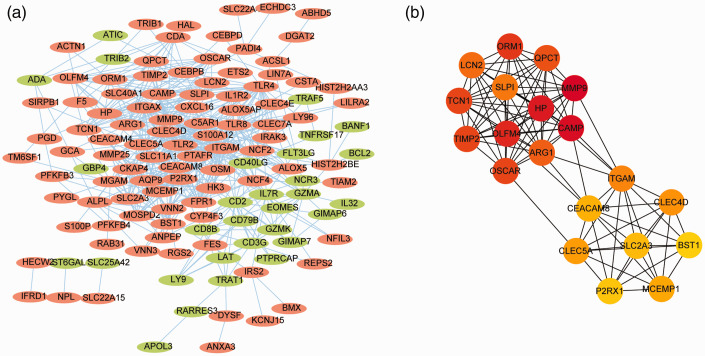
Figure 3.
Construction of the PPI network. (a) PPI network of shared genes. Each dot represents a node. importance of the gene in the network is reflected by the degree of the node which is represented by the number of lines connected to the dot (node). A thicker line reflects a stronger interaction between two nodes. Red points represent up-regulated genes and blue points represent down-regulated genes. (b) The network of key genes selected using the Maximal Clique Centrality algorithm. Important genes are shown in darker colors.
PPI, protein–protein interaction.

