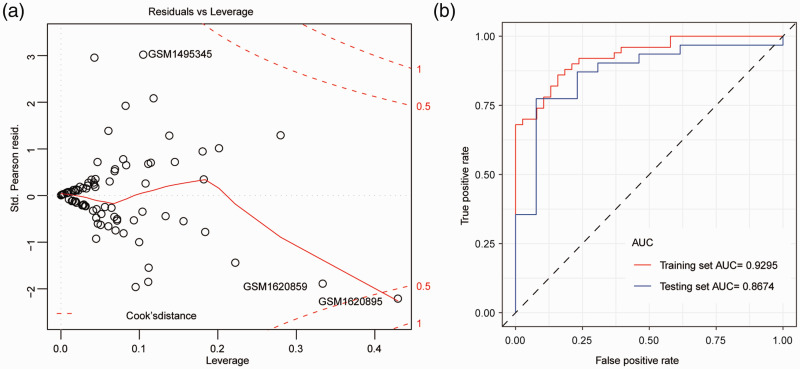
Figure 4.
Construction of the logistic regression diagnostic model. (a) The logistic regression diagnostic model. Red dashed line indicates the COOK distance. (b) The ROC curve. The horizontal axis represents the false positive rate and the vertical axis represents the true positive rate.
ROC, receiver operating characteristic.

