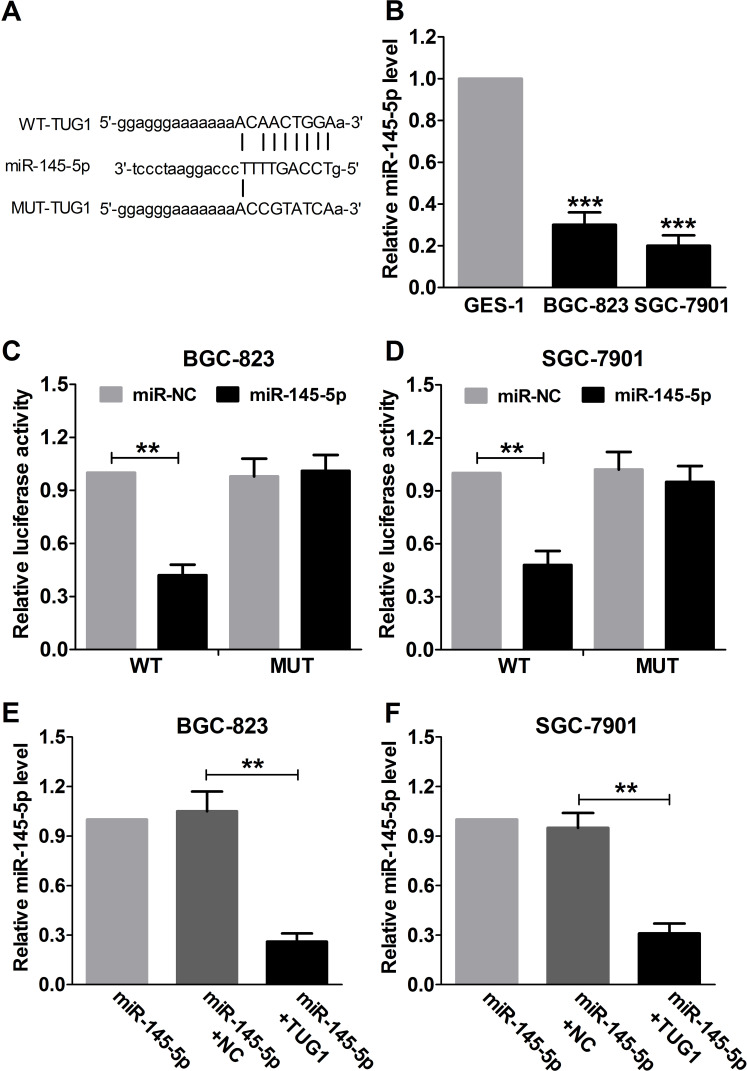
Figure 3.
Regulatory relationship between TUG1 and miR-145-5p. (A) Bioinformatics analysis of the predicted target sites for miR-145-5p in TUG1. (B) qRT-PCR was used to analyze the expression of miR-145-5p in GC cell lines (BGC-823 and SGC-7901) and nonmalignant gastric epithelial cell line GES-1. GAPDH was used as the internal control. Luciferase activity in BGC-823 (C) and SGC-7901 (D) cells cotransfected with miR-145-5p or miR-NC and WT or MUT was analyzed by luciferase reporter assay. Renilla luciferase activity was used for normalization. qRT-PCR was used to detect the miR-145-5p levels in GC BGC-823 (E) and SGC-7901 (F) cells transfected with miR-145-5p, miR-145-5p + NC, or miR-145-5p + TUG1. **p < 0.01, ***p < 0.001.

