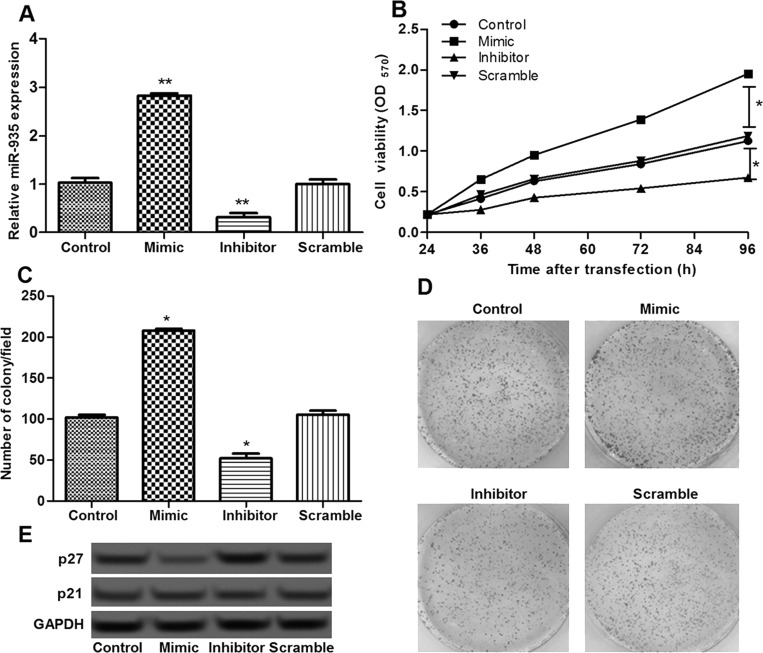
Figure 2.
The effects of miR-935 on cell proliferation. (A) The expression of miR-935 in different transfection groups. (B) The MTT assay showed the cell viability of different transfection groups. (C, D) The colony assay showed the number of colonies of different transfection groups. (E) The expression level of p27 in different groups determined by Western blot. Error bars indicate means ± SD. *p < 0.05 and **p < 0.01 (compared with the control group).

