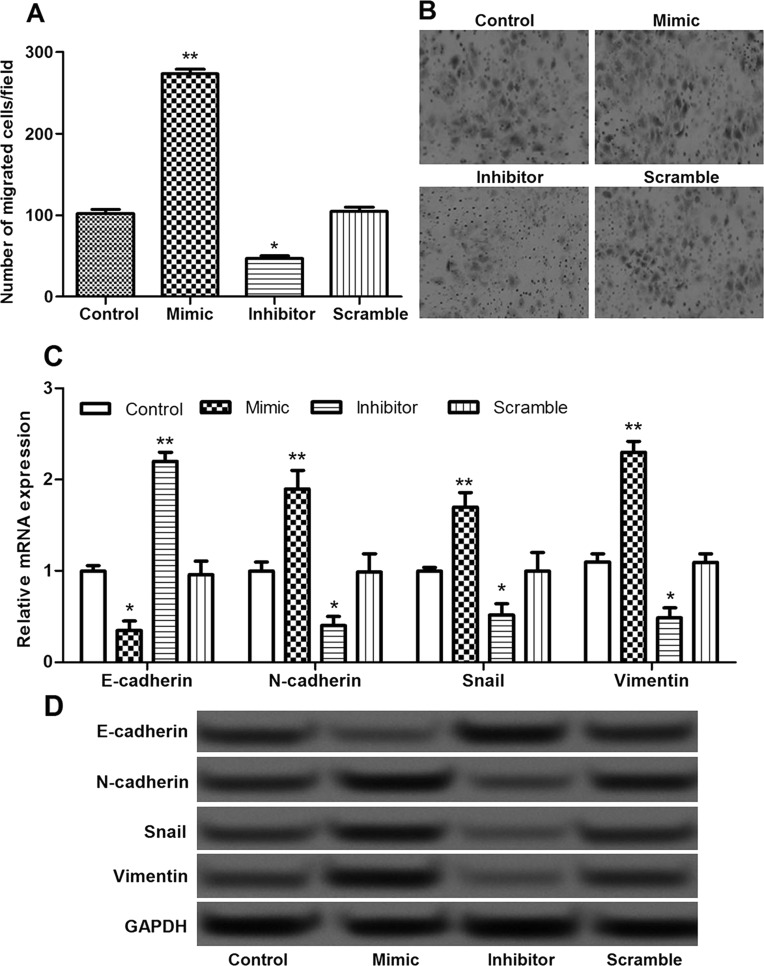
Figure 3.
The effects of miR-935 on cell migration. (A, B) The Transwell assay showed the number of migrated cells in different transfection groups. (C) The expression levels of N-cadherin, E-cadherin, Snail, and vimentin in different groups determined by qRT-PCR. (D) The expression levels of N-cadherin, E-cadherin, Snail, and vimentin in different groups determined by Western blot. Error bars indicate means ± SD. *p < 0.05 and **p < 0.01 (compared with the control group).

