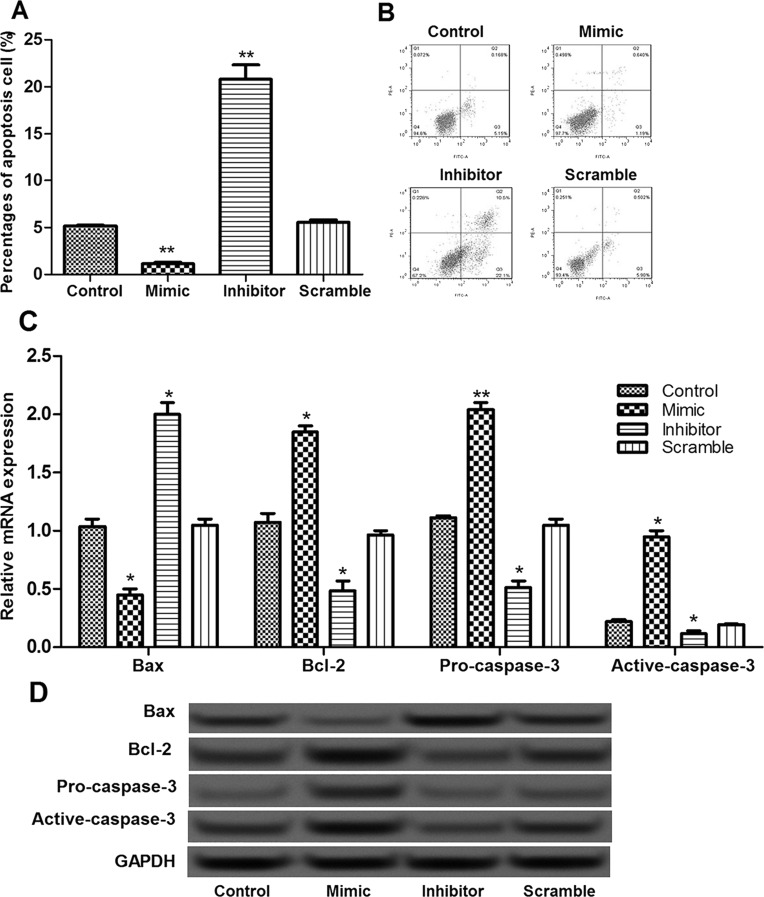
Figure 4.
The effects of miR-935 on cell apoptosis. (A, B) Flow cytometry showed the percentage of apoptotic cells in different transfection groups. (C) The expression levels of Bax, Bcl-2, procaspase 3, and active caspase 3 in different groups determined by qRT-PCR. (D) The expression levels of Bax, Bcl-2, procaspase 3, and active caspase 3 in different groups determined by Western blot. Error bars indicate means ± SD. *p < 0.05 and **p < 0.01 (compared with the control group).

