Figure 2.
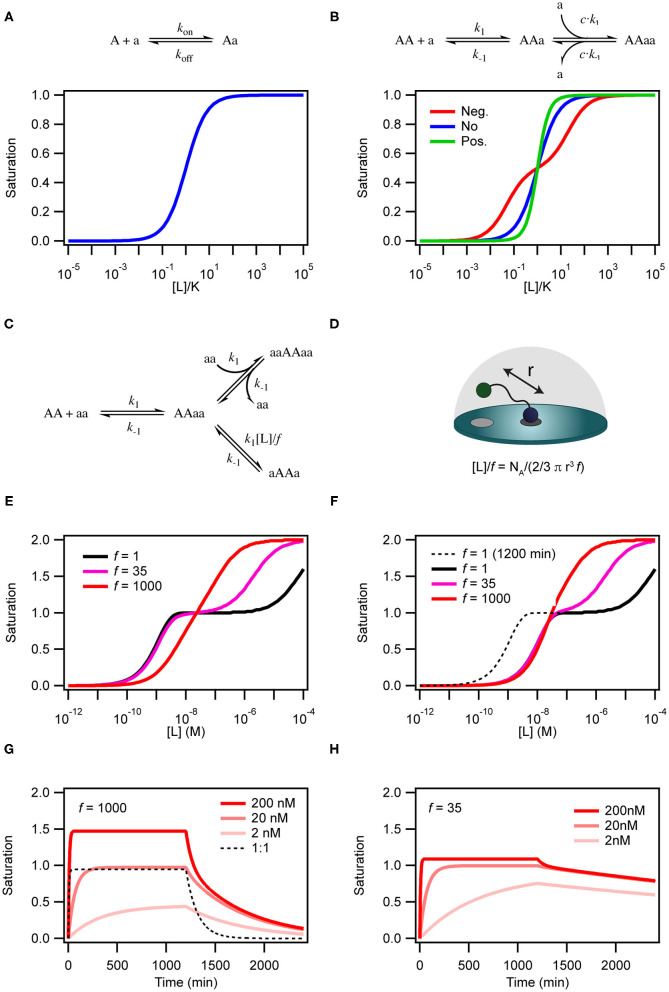
Simulations of binding curves. (A) Equilibrium binding curve for a monovalent ligand binding to a monovalent receptor. (B) Equilibrium binding curves for a monovalent ligand binding to a dimeric (or divalent) receptor in case of negative cooperativity, Kd1 = 0.01Kd2 (red), no cooperativity (blue) and positivity cooperativity, Kd1 = 100Kd2 (green). In the case of cooperativity, the scale on the x-axis is calculated with K = √Kd1Kd2. For the non-cooperative case K = Kd. (C) Model for binding of a homo-divalent ligand to a homo-divalent receptor. All steps are assumed to have the same microscopic rate constants, k1 and k−1. The intra-molecular binding reaction AAaa to aAAa is also controlled by the effective ligand concentration [L] and the empiric proximity factor f that accounts for steric restrictions on the intramolecular process compared with the intermolecular process. (D) For the intramolecular binding to a receptor on a surface, the local concentration is calculated as the concentration of the ligand in half-sphere with a radius equal to the distance between two binding sites on the ligand when it is fully extended. (E) Binding curves for the model in c with [AA] = 0.1 nM k1 = 1.85 × 10⁵ M−1min−1 and k−1 = 8.5 × 10⁻³ min−1 at three different values of f and [L] = 136 μM simulated after 1,200 min equilibration. (F) Same as in (E) except that the curves were extracted after 120 min. (G) Time traces of binding and dissociation for the model in (C) at three different ligand concentrations, with f = 1,000 and other parameters as in (E). For comparison the time trace for at 1 to 1 binding reactions with kon = 1.85 × 10⁵ M−1min−1 and koff = 8.5 × 10⁻³ min−1. (H) Same as in (G), except f = 35. ll simulations were performed with COPASI (Hoops et al., 2006).

