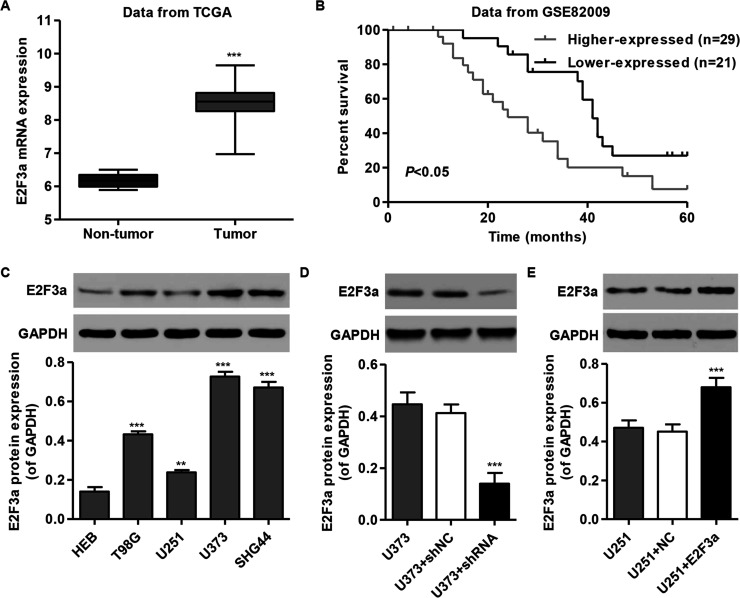
Figure 1.
E2F3a expression in glioma tissues and cell lines. (A) Comparison of the expression level of E2F3a between glioma and nontumor tissues in TCGA. (B) Kaplan–Meyer survival curves for two groups of patients in GSE82009. Black, data for patients with low prognostic scores (group 1, higher survival time); gray, patients with high prognostic scores (group 2, poorer survival). (C) E2F3a expression level in four glioma cell lines and normal human embryonic brain (HEB) cells was analyzed by Western blot. (D, E). Expression of E2F3a in U373 and U251 cells was analyzed by Western blot. GAPDH was also detected as the internal control. Representative Western blots (top) and quantitative results are shown (bottom). **p < 0.01 compared with HEB cells; ***p < 0.001 compared with HEB cells or corresponding control cells.

