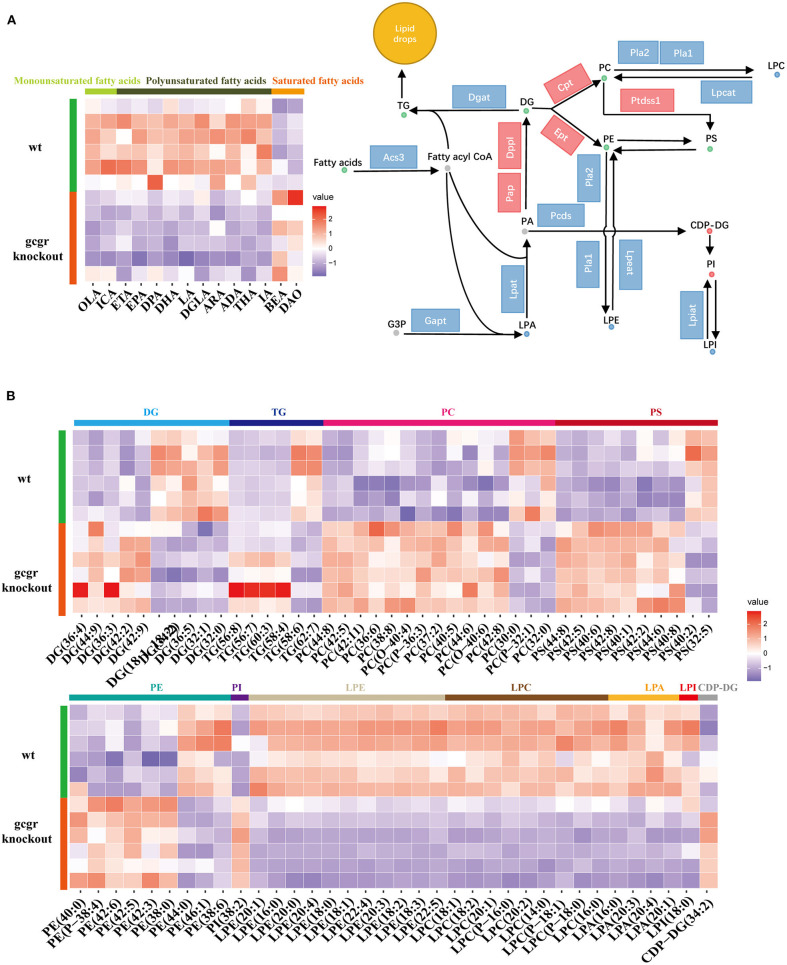
Figure 3.
GCGR knockout induced glycerophospholipid metabolism dysregulation. (A) Disturbed glycerophospholipid metabolism. Dots represent metabolites, and blocks represent transcripts-encoded enzymes. Red: up-regulated, blue: down-regulated; or green: set substrates mixed with both up-regulated and down-regulated metabolites. The left displayed the heatmap enriched fatty acids. (B) Heatmap of corresponding glycerophospholipid metabolite sets. Z score normalized ionic strength for each metabolite was represented by different colors: high (red), low (blue), or average (white). The class of each pathway was marked by the color bar on the top.

