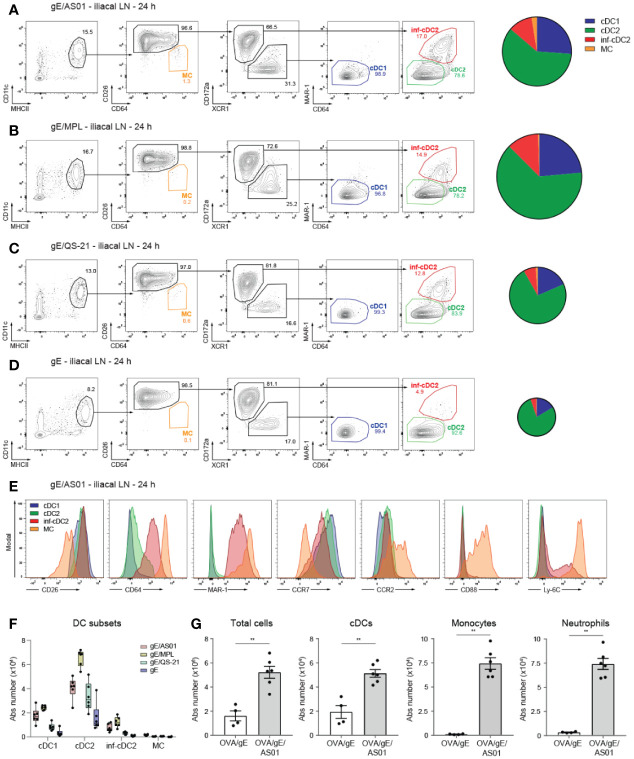
Figure 1.
cDC subsets are recruited to the draining lymph node after i.m. AS01 immunization. (A–D) Gating strategy of migratory MHCIIhi DC subsets pre-gated on live CD3-CD19- cells (left panel) and pie charts depicting relative distribution of DC subset (right panel) in the dLN 24 h after i.m. (M. gastrocnemius) immunization with 2 µg VZV gE antigen formulated in 1 µg AS01 (A), MPL (B), QS-21 (C), or buffer (D) per injection site. (E) Histograms showing surface expression of cDC, monocyte and macrophage markers on different DC subsets in the dLN 24 h after i.m. immunization with gE/AS01 as in Figure 1A. (F) Absolute number of DC subsets in the dLN 24 h after i.m. immunization with the different compounds as in Figures 1A–D. (G) Absolute number of total cells, cDCs, monocytes and neutrophils in the dLN 24 h after i.m. immunization with OVA/gE (0.5/2.5 µg) formulated in 2.5 µg AS01 or buffer per injection site. AS01, MPL, and QS-21 are all in liposome. Data are representative of at least 2 independent experiments (n = 4–6 mice per group). Size of the pie chart is proportional to the absolute number of DCs in the dLN (A–D). Error bars indicate mean ± SEM (G). Data analyzed with a Mann-Whitney test **p < 0.01.

