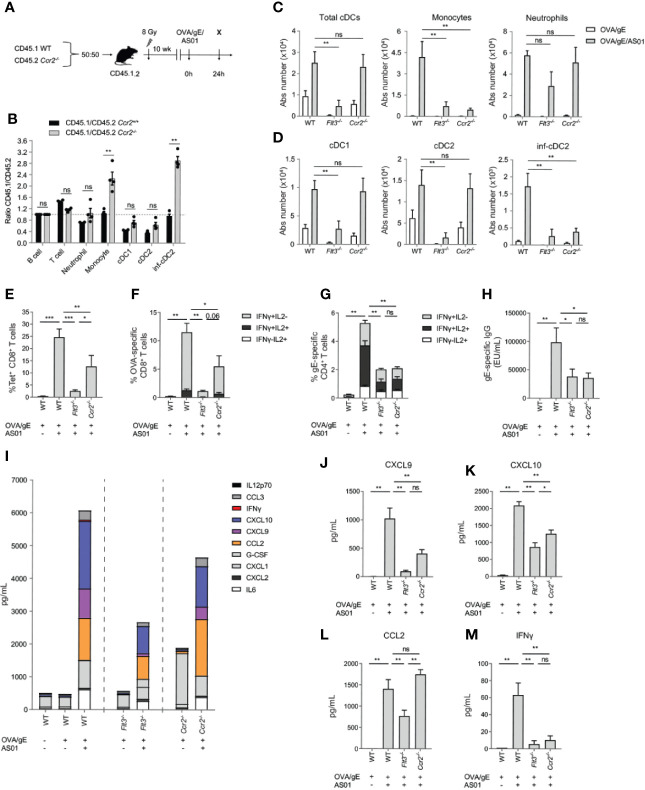
Figure 4.
Both Flt3 and CCR2 dependent cells are required for optimal adaptive response driven by AS01. (A) Schematic representation of CD45.1 WT: CD45.2 Ccr2-/- BM chimeras. (B) Normalized CD45.1/CD45.2 ratio relative to B cells of cell subsets in the dLN 24 h after i.m. immunization with OVA/gE/AS01 (0.5/2.5/2.5 µg) per injection site. (C) Absolute number of total cDCs, monocytes and neutrophils in the dLN of WT, Flt3-/-, and Ccr2-/- mice 24 h after i.m. immunization with OVA/gE (0.5/2.5 µg) formulated in 2.5 µg AS01 or buffer per injection site. (D) Absolute number of different cDC subsets in the dLN of WT, Flt3-/-, and Ccr2-/- mice 24 h after i.m. immunization with OVA/gE (0.5/2.5 µg) formulated in 2.5 µg AS01 or buffer per injection site. (E) Percentage OVA257–264 MHCI-Tetramer+ CD8+ T cells in the spleen of WT, Flt3-/-, and Ccr2-/- mice 21 days after i.m. immunization with OVA/gE (0.5/2.5 µg) formulated in 2.5 µg AS01 or buffer per injection site. Same set-up as in Figure 3E without DT treatment. (F) Percentage IFN-γ and/or IL2 producing CD8+ T cells upon OVA restimulation in the spleen of WT, Flt3-/-, and Ccr2-/- mice 21 days after i.m. immunization with OVA/gE (0.5/2.5 µg) formulated in 2.5 µg AS01 or buffer per injection site. Same set-up as in Figure 3E without DT treatment. (G) Percentage IFN-γ and/or IL2 producing CD4+ T cells upon VZV gE restimulation in the spleen of WT, Flt3-/-, and Ccr2-/- mice 21 days after i.m. immunization with OVA/gE (0.5/2.5 µg) formulated in 2.5 µg AS01 or buffer per injection site. Same set-up as in Figure 3E without DT treatment. (H) Total VZV gE specific IgG levels in the serum of WT, Flt3-/-, and Ccr2-/- mice 21 days after i.m. immunization with OVA/gE (0.5/2.5 µg) formulated in 2.5 µg AS01 or buffer per injection site. Same set-up as in Figure 3E without DT treatment. (I–M) Cytokine and chemokine levels in serum of WT, Flt3-/-, and Ccr2-/- mice 24 h after i.m. immunization with OVA/gE (0.5/2.5 µg) formulated in 2.5 µg AS01 or buffer per injection site. Shown individually for CXCL9 (J), CXCL10 (K), CCL2 (L), and IFN-γ (M). (A–M) Data are representative of 4 independent experiments (n = 2–5 mice per group). Error bars indicate mean ± SEM. Data analyzed with a Two-way ANOVA (B–D) or One-way ANOVA (E–M) and Sidak’s multiple comparison test. *p < 0.05, **p < 0.01, ***p < 0.001, ns, non-significant.

