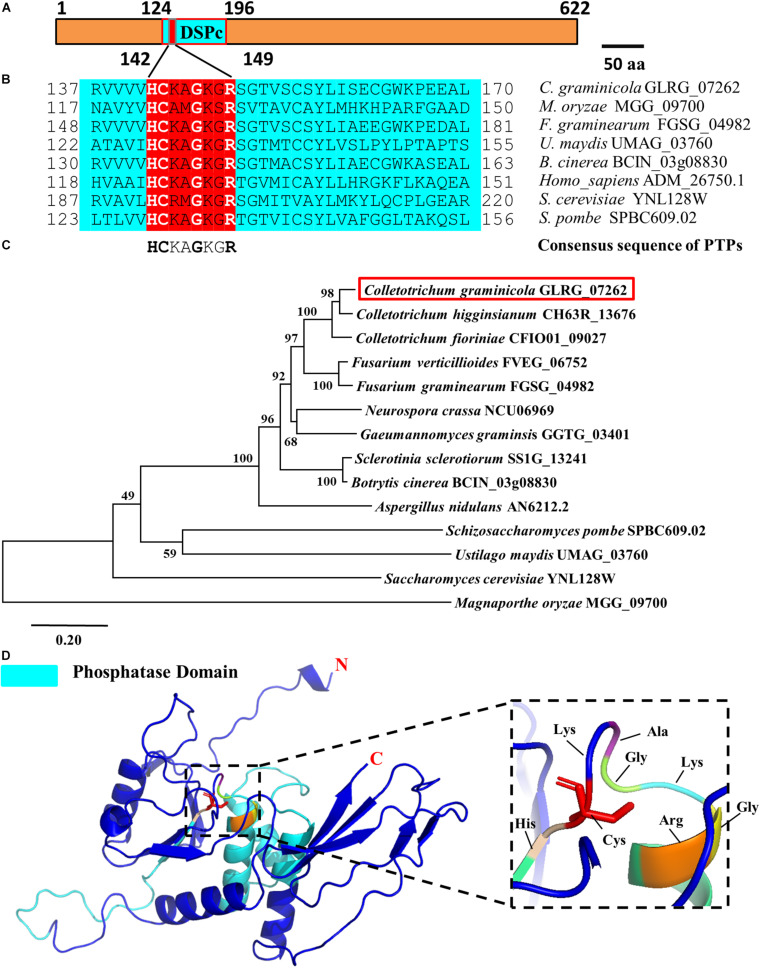
FIGURE 1.
Bioinformatics analysis of the CgPTPM1 gene in C. graminicola. (A) A schematic representation of the domain architecture of CgPTPM1. The phosphatase domain of CgPTPM1 is from position 124 to 196, and the amino acid sequences from positions 142 to 149 are the catalytic core motif. The essential Cys residue is located at position 143. (B) Comparative analysis of conserved regions in the protein. The catalytic domain of CgPTPM1 is compared with the phosphatase catalytic domain sequences that have been reported in other species. These species include Saccharomyces cerevisiae S288C, Schizosaccharomyces pombe, Homo sapiens, Magnaporthe oryzae 70-15, Fusarium graminearum PH-1, Ustilago maydis 521 and Botrytis cinerea B05.10. The red box marks the phosphatase catalytic core motifs in different species. (C) Phylogenetic tree of protein CgPTPM1 (GLRG_07262, marked in red). The phylogenetic tree represents the genetic relationship between CgPTPM1 and its homologous proteins in different species. An analysis of homologous amino acid sequence alignments was performed using the MUSCLE program, and a phylogenetic tree was constructed using the Neighbor-Joining algorithm. (D) Prediction of the spatial structure of protein CgPTPM1. The online software SWISS-MODEL was used to predict the three-dimensional structure of the protein, and PyMOL was used to organize and map the content. The cyan area in the structure represents the phosphatase domain. The enlarged part is the catalytic core motif, including 8 amino acid residues that are marked.

