FIGURE 2.
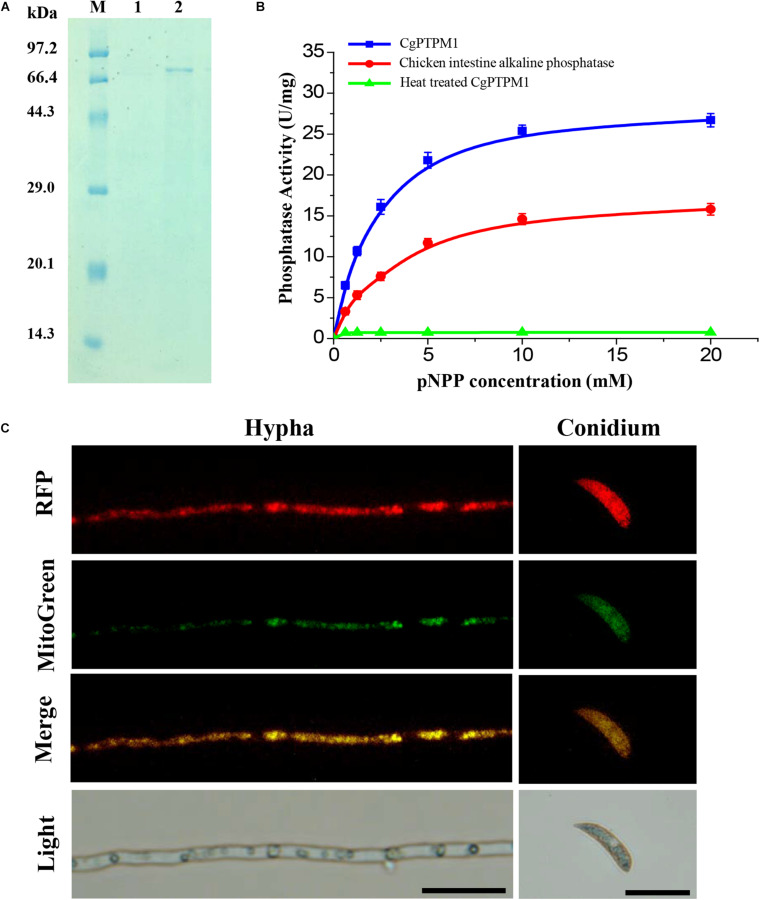
Expression and purification, phosphatase activity test, and subcellular localization of the CgPTPM1 protein. (A) SDS-PAGE analysis of CgPTPM1. Lane M: protein marker (TaKaRa, Dalian, China). Lane 1: the negative control without induction of isopropyl-ß-D-thiogalactopyranoside (IPTG). Lane 2: expression and purification induced by 1 mM IPTG. (B) Phosphatase activity test. The enzyme activity was measured using pNPP as a substrate. The standard chicken intestine alkaline phosphatase was used as the positive control, and the inactivated CgPTPM1 served as the negative control. As the substrate concentration increased, the enzymatic reaction rate increased, and the data conformed to the Michaelis-Menten equation. Error bars represent ± SD of three independent repeated samples. (C) Subcellular localization of CgPTPM1 in C. graminicola. The CgPTPM1-RFP fusion protein was used to observe the distribution of CgPTPM1, and the green fluorescent dye MitoTracker Green® FM was used to label the mitochondria in the cells. In the merged image, the original red fluorescence from CgPTPM1-RFP colocalized with the green fluorescence Mito-Green appearing as yellow areas. Scale bar = 20 μm.

