
Figure 2.
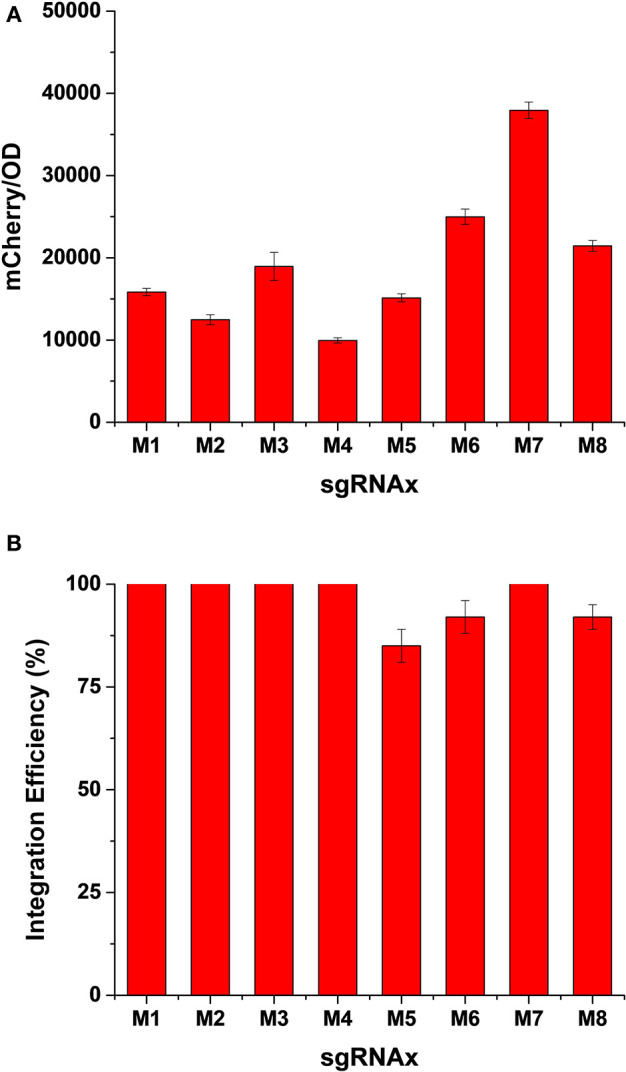
Evaluation of expression level (A) and integration efficiency (B) of heterologous genes in different genomic loci of the expression chassis. The integration efficiency was calculated as number of colonies with mCherry fluorescence/total number of colonies tested. Error bars represented the mean ± s.d. of biological triplicates.