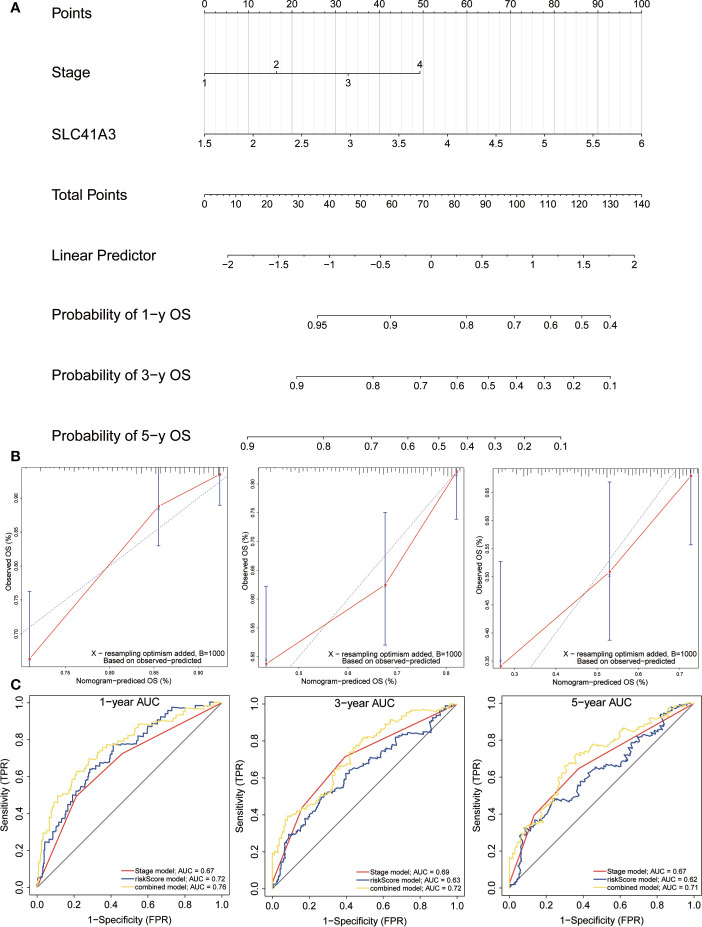
Figure 12.
Construction and evaluation of nomogram. (A) The nomogram is applied by adding up SLC41A3 TPM value and stage plot. The total points projected on the bottom scales implied the probability 1-, 3-, 5-years overall survival. (B) Calibration curves of the nomogram for the prediction of survival rates at 1-, 3-, 5- year. The nomogram-predicted probability of survival is plotted on the x-axis; and the actual survival is plotted on the y-axis. (C) ROC curve analysis evaluates the accuracy of the nomograms.

