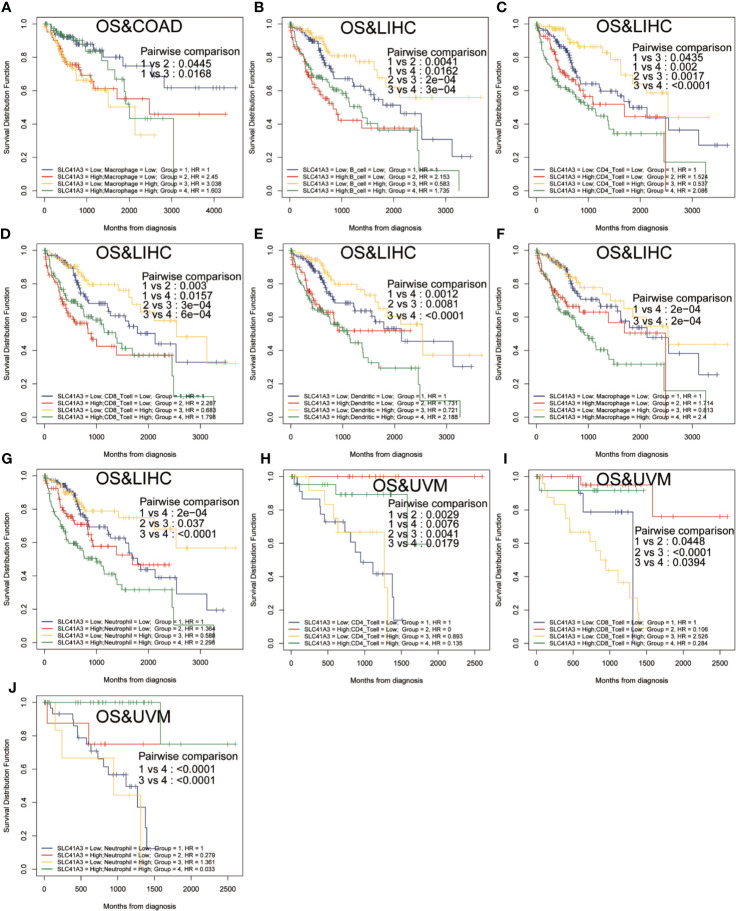
Figure 6.
Overall survival (OS) curves using combinations SLC41A3 expression and Immune cells score. (A) OS analysis of combinations SLC41A3 expression and Macrophage cell score in colon adenocarcinoma (COAD). (B) OS analysis of combinations SLC41A3 expression and B cell score in liver hepatocellular carcinoma (LIHC). (C) OS analysis of combinations SLC41A3 expression and CD4+ T cell score in LIHC. (D) OS analysis of combinations SLC41A3 expression and CD8+ T cell score in LIHC. (E) OS analysis of combinations SLC41A3 expression and dendritic cell score in LIHC. (F) OS analysis of combinations SLC41A3 expression and macrophage cell score in LIHC. (G) OS analysis of combinations SLC41A3 expression and neutrophil cell score in LIHC. (H) OS analysis of combinations SLC41A3 expression and CD4+ T cell score in uveal melanoma (UVM). (I) OS analysis of combinations SLC41A3 expression and CD8+ T cell score in UVM. (J) OS analysis of combinations SLC41A3 expression and Neutrophil cell score in UVM. p< 0.05 was considered significant.

