FIGURE 3.
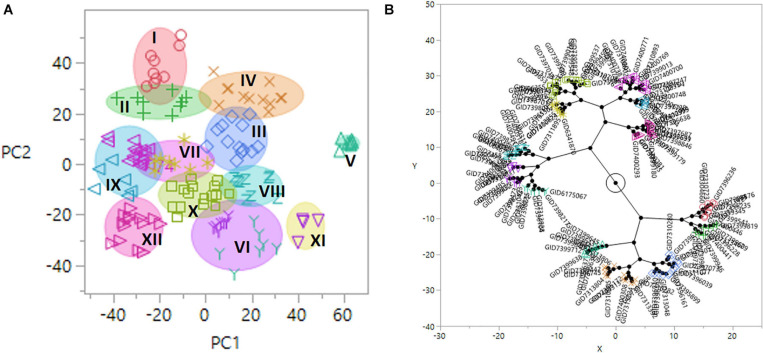
(A) Diagram of principal component (PC) 1 and 2 vectors calculated by the principal component analysis (PCA) of 14,063 genotyping-by-sequencing (GBS) single-nucleotide polymorphism (SNP) markers in 139 advanced wheat breeding lines, plotted in 12 population groups (I–XII). The x-axis and y-axis represent projections of the PC1 and PC2, respectively. (B) Constellation plot using the Ward method in JMP v.14.

