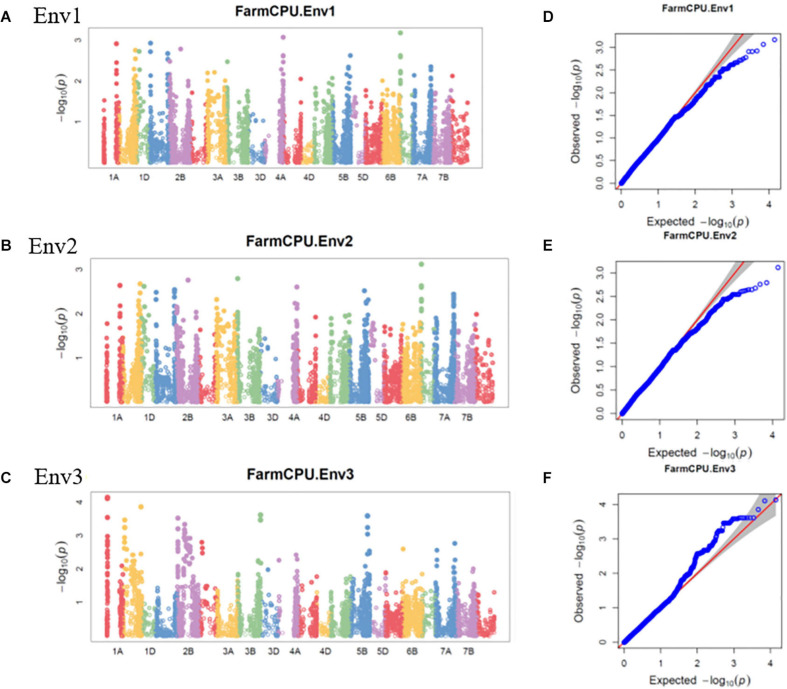
FIGURE 4.
Manhattan plots representing 21 chromosomes showing the significant markers detected by FarmCPU model using BLUP values for spot blotch in (A) Env1, (B) Env2, and (C) Env3 environments. Quantile–quantile (Q–Q) plots for spot blotch in Env1 (D), Env2 (E), and Env3 (F) environments showing expected null distribution of p-values, assuming no associations, represented as a red solid line v/s; distribution of p-values observed using FarmCPU model represented as the blue dots.

