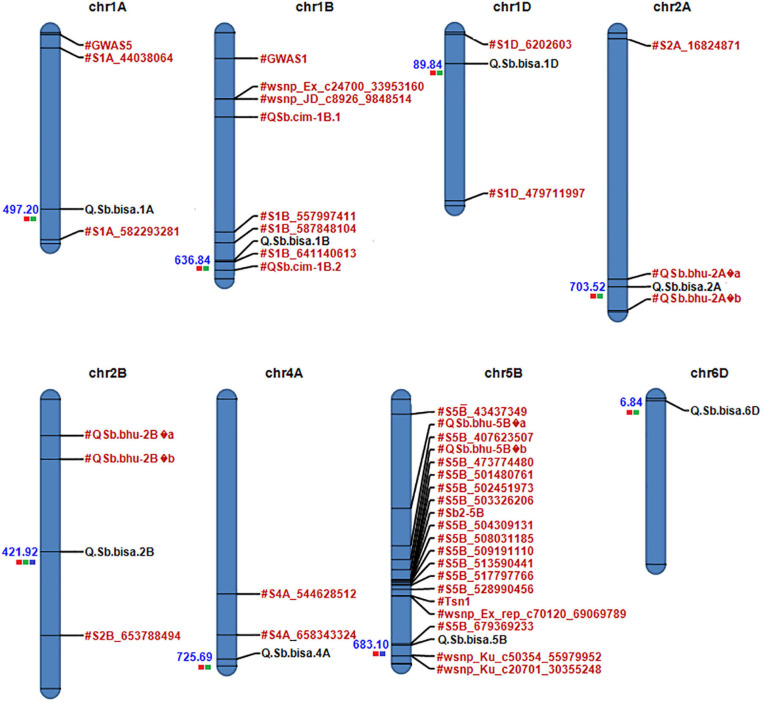
FIGURE 5.
Physical map of candidate QTLs on 1A, 1B,1D, 2A, 2D, 4A, 5B, and 6D chromosomes. Significant QTLs/associated with spot blotch are highlighted in black, while previously reported QTLs/markers are labeled in red (the red color box next to QTLs for Env1, green for Env2, and blue for Env3). The physical position is based on IWGSC 2018 (RefSeq v1.0).

