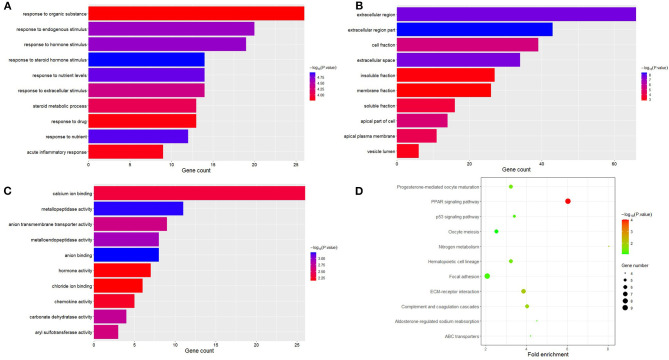
Figure 3.
Functional analysis of differential expression genes. Biological process (BP), cell composition (CC), and molecular function (MF) are the components of GO enrichment analysis results, and each part displays 10 GO terms (A–C). The result shown by KEGG is a pathway of enrichment of DGEs (D).

