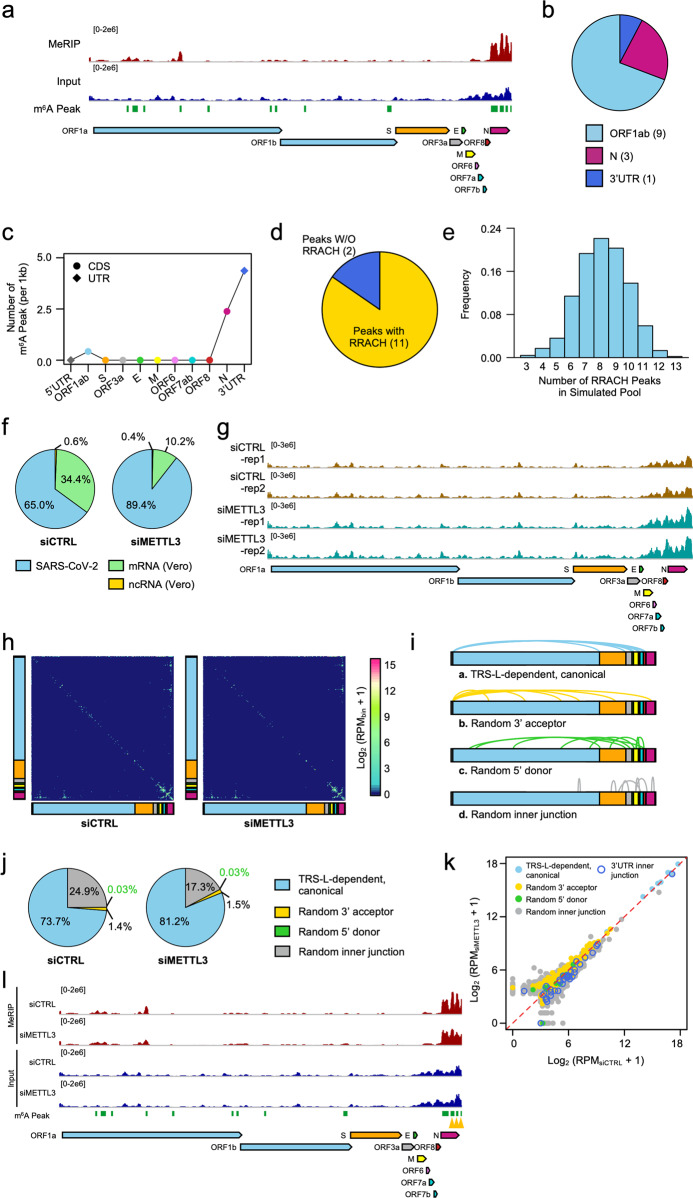
Fig. 1. m6A methylome and diverse 3′UTR in SARS-CoV-2.
a Integrative Genomics Viewer (IGV) tracks displaying read distributions from m6A MeRIP-seq (upper panel) and RNA-seq (lower panel) along SARS-CoV-2 positive-sense RNA. The green rectangles at the bottom depict the positions of identified m6A peaks. b Pie chart showing the fraction of m6A peaks in different segments along SARS-CoV-2 RNA genome. c Line chart revealing m6A peak numbers per 1 kb for each segment along SARS-CoV-2 RNA genome by normalizing with its length, respectively. The diamonds represent UTRs and dots represent CDS regions along complete SARS-CoV-2 genomic RNA. d Pie chart depicting the proportion of m6A peaks containing RRACH (yellow) or not (blue). e Histogram showing the frequency of RRACH peak number in 1000 simulated peak pools of SARS-CoV-2 genome. f Pie chart showing proportion of reads annotated as Chlorocebus sabaeus mRNA (green), ncRNA (yellow), and SARS-CoV-2 RNA (blue). g IGV tracks showing read distribution from RNA-seq along SARS-CoV-2 RNA in both control (upper panel) and METTL3-depleted Vero cells (lower panel). The read counts were normalized by ERCC for each batch, respectively. h Heatmap showing the frequency of junction-spanning reads along SARS-CoV-2 RNA genome from control (left) and METTL3-depleted Vero cells (right). The counts were aggregated into 100-nt bins for both axes. i Models present four different types of junction-spanning reads. (a) TRS-L-dependent, canonical fusion mediated by TRS-L and TRS-B; (b) Random 3′ acceptor represents noncanonical fusion mediated by TRS-L but not TRS-B; (c) Random 5′ donor represents long-distance fusion mediated by TRS-B but not TRS-L; (d) Random inner junction identified as TRS-independent spanning. j Pie chart showing the proportions of four different types of junction-spanning reads. k Scatterplot showing the relative expression levels of four different junction-spanning transcripts in control and METTL3-depleted Vero cells which were presented in different colors, respectively. The blue circle represents the spanning-junctions located in 3′UTR. l IGV tracks displaying read distribution from m6A MeRIP-seq along SARS-CoV-2 RNA genome in both control and METTL3 knockdown samples. The green rectangles depict the positions of m6A peaks identified in control samples and yellow triangles at the bottom represent peaks with significant decreased methylation level in METTL3 knockdown samples.

